Three days before this analysis started, the Hack It Out Golf podcast ran a Saturday Morning Golf Stat asking one question: "How far do you need to hit it—in the fairway—to break even on a strokes gained against your handicap peers?" Mark Crossfield, Lou Stagner, and Greg Chalmers ran it for scratch and a 10-index on a 400-yard hole. I could not let the question go, so I built the model and ran it at every handicap.
Club ads sell distance, and most tee-box advice does too. The numbers below put an exact price on it, and the price is smaller than the pitch. One note on framing before the charts: the episode asks the question for a drive that finds the fairway; this model prices the miss odds too, so fairway, rough, and trouble all weigh in.
The model plays the whole hole, because judging the tee shot on its own hides half the cost. A 220-yard drive on a 400-yard par 4 looks harmless until you price the 180-yard approach it creates. So the model prices it: your dispersion sets the odds of fairway, rough, and trouble, the leftover yardage and lie set the expected strokes to hole out, and the sum is an expected score. Strokes gained zero means you played the hole like a typical golfer at your handicap.
The cost line
The number that matters is what I call the cost line: the drive distance below which a hole starts costing you more than a tenth of a stroke against your own number. That margin works out to one shot per ten rounds. Chart 1 draws it for every handicap tier and every par-4 length, and it sits under every tier's average drive, everywhere on the grid.
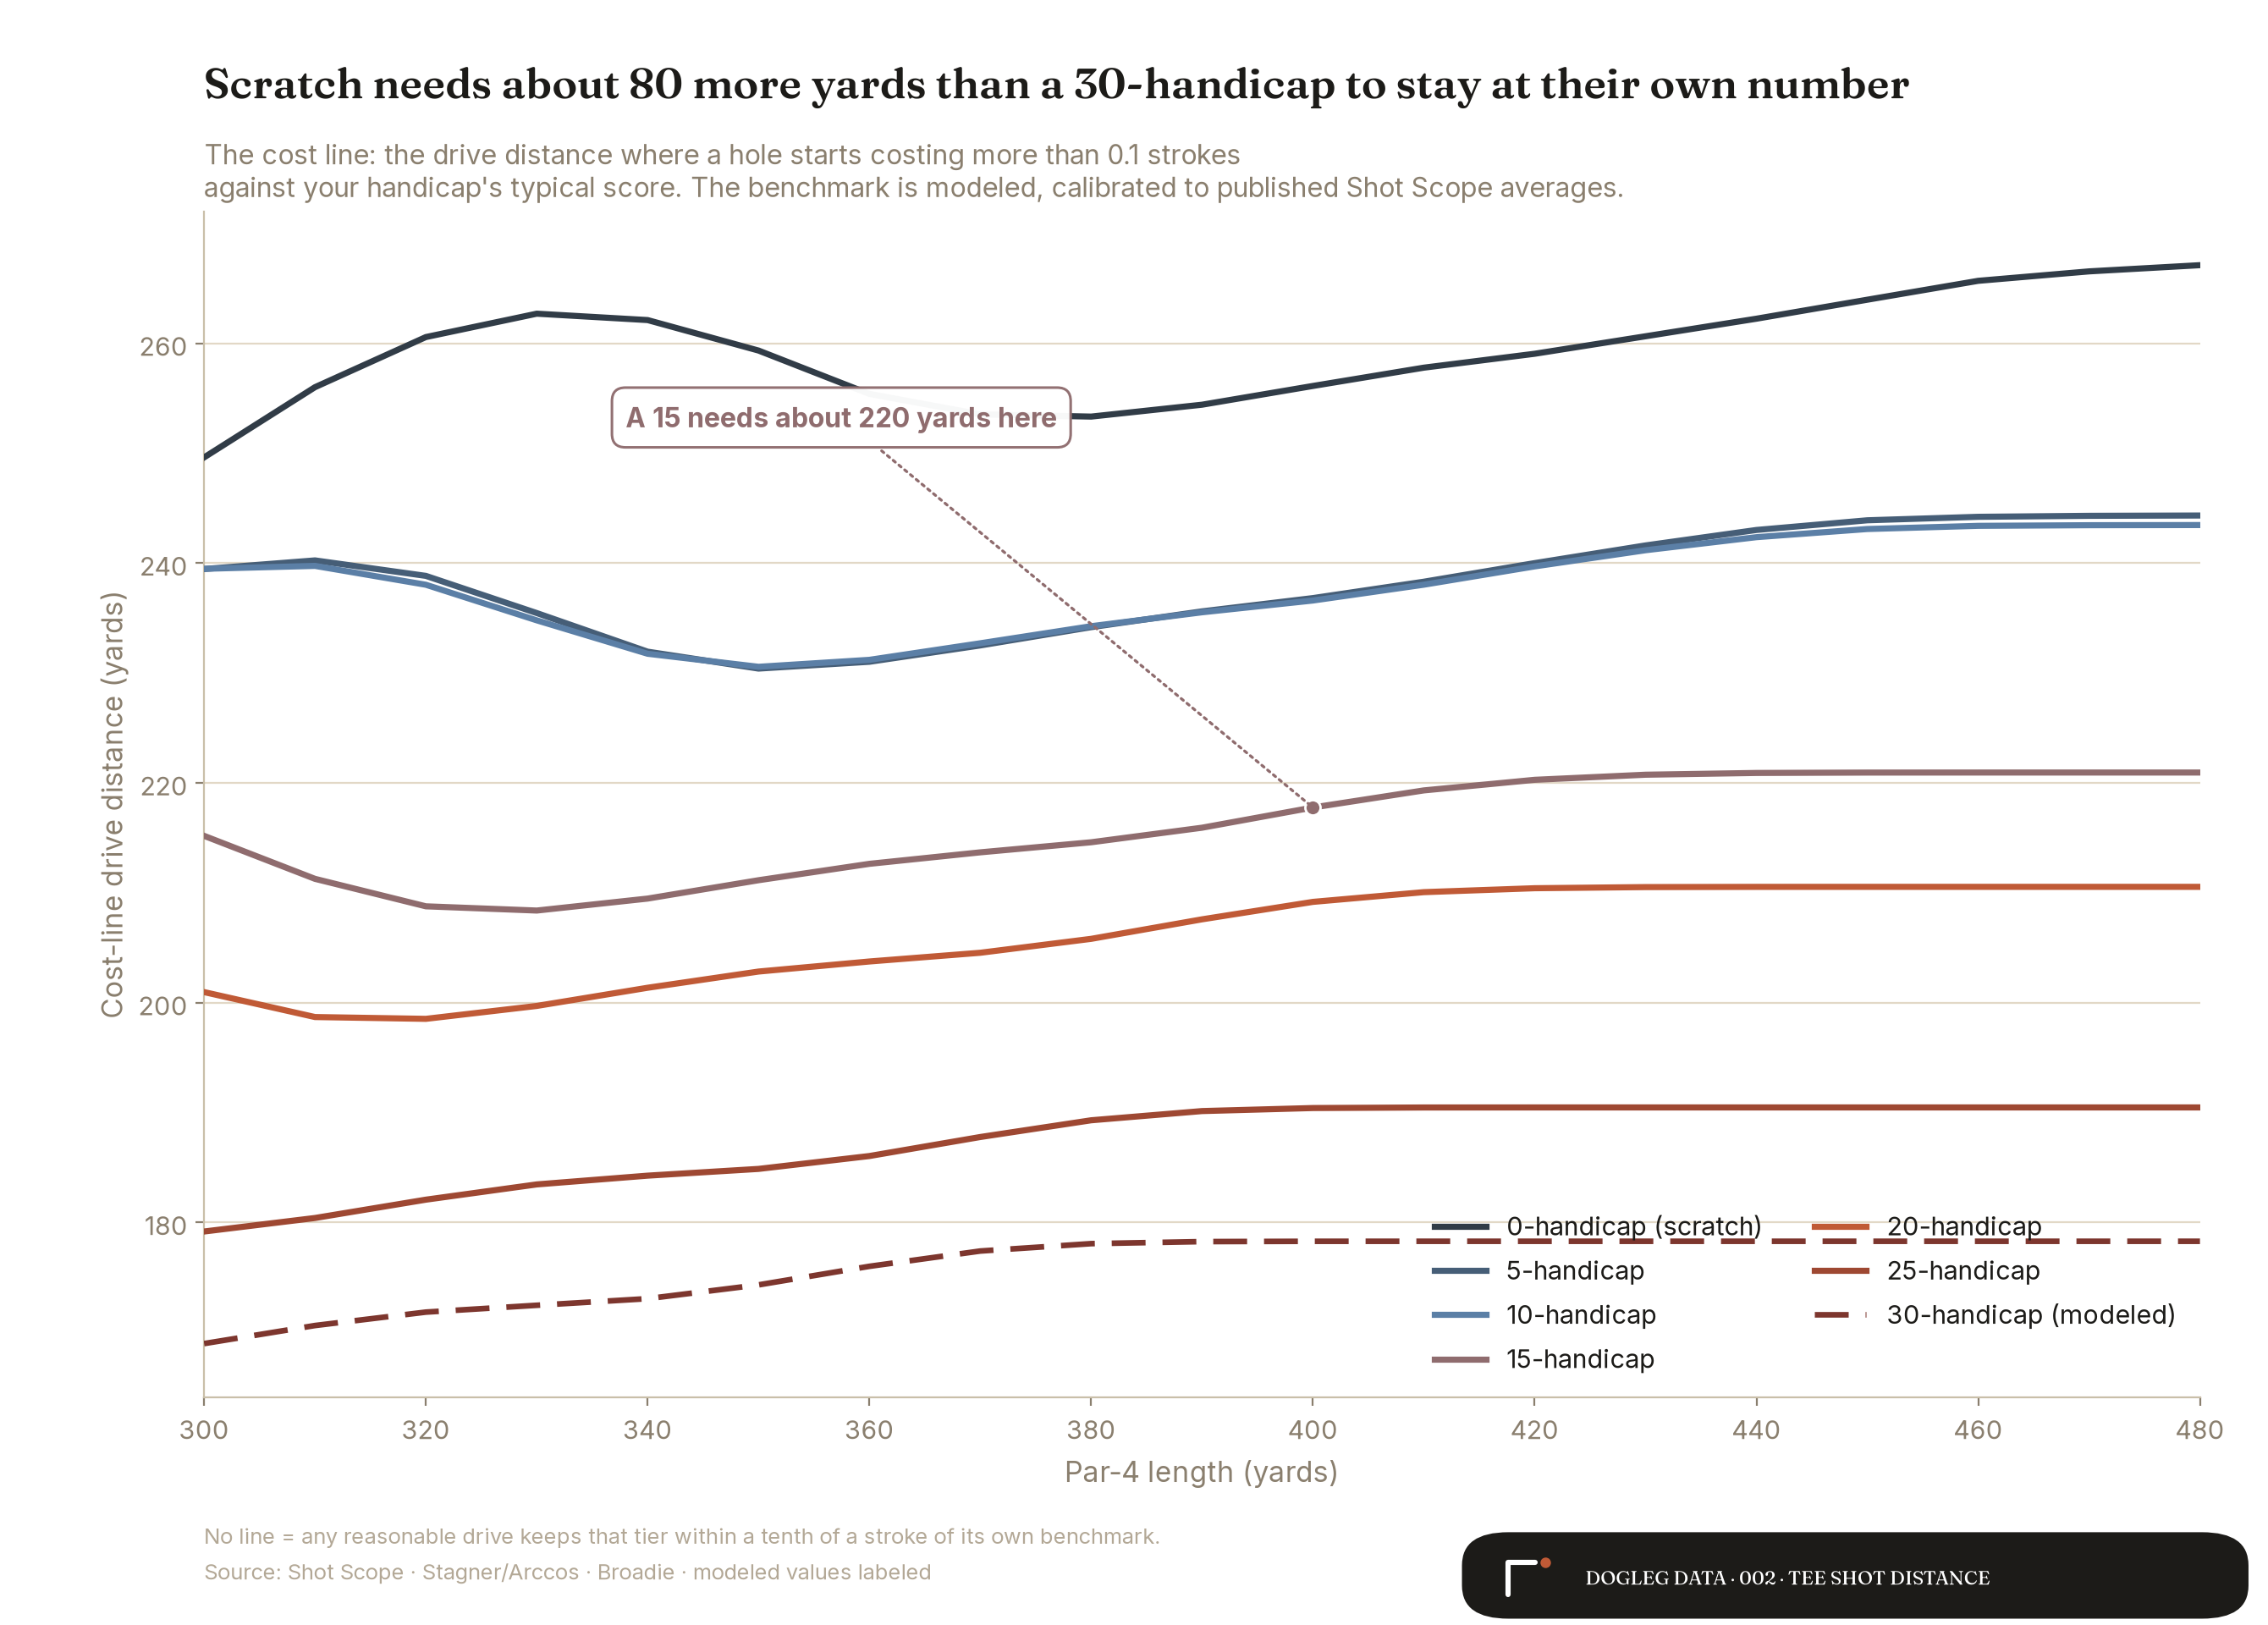
Read your own row. A 15-handicap on a 400-yard par 4 clears the line at 218 yards, against a 236-yard tier average. A 20-handicap clears it at 209. The gap between tiers is real: a scratch golfer needs about 80 more yards than a 30-handicap (a modeled tier) because the benchmark they have to match is so much tougher. Within your own tier, though, your usual drive clears the bar with room.
Their answer, and mine
After this analysis was built, I got the episode's own numbers. Stagner ran them from the Arccos database for a drive that finds the fairway: 230 yards for scratch and 200 for a 10-index on the same 400-yard hole, with a rule of thumb that the break-even sits about 30 yards under the typical player's average drive at that level.
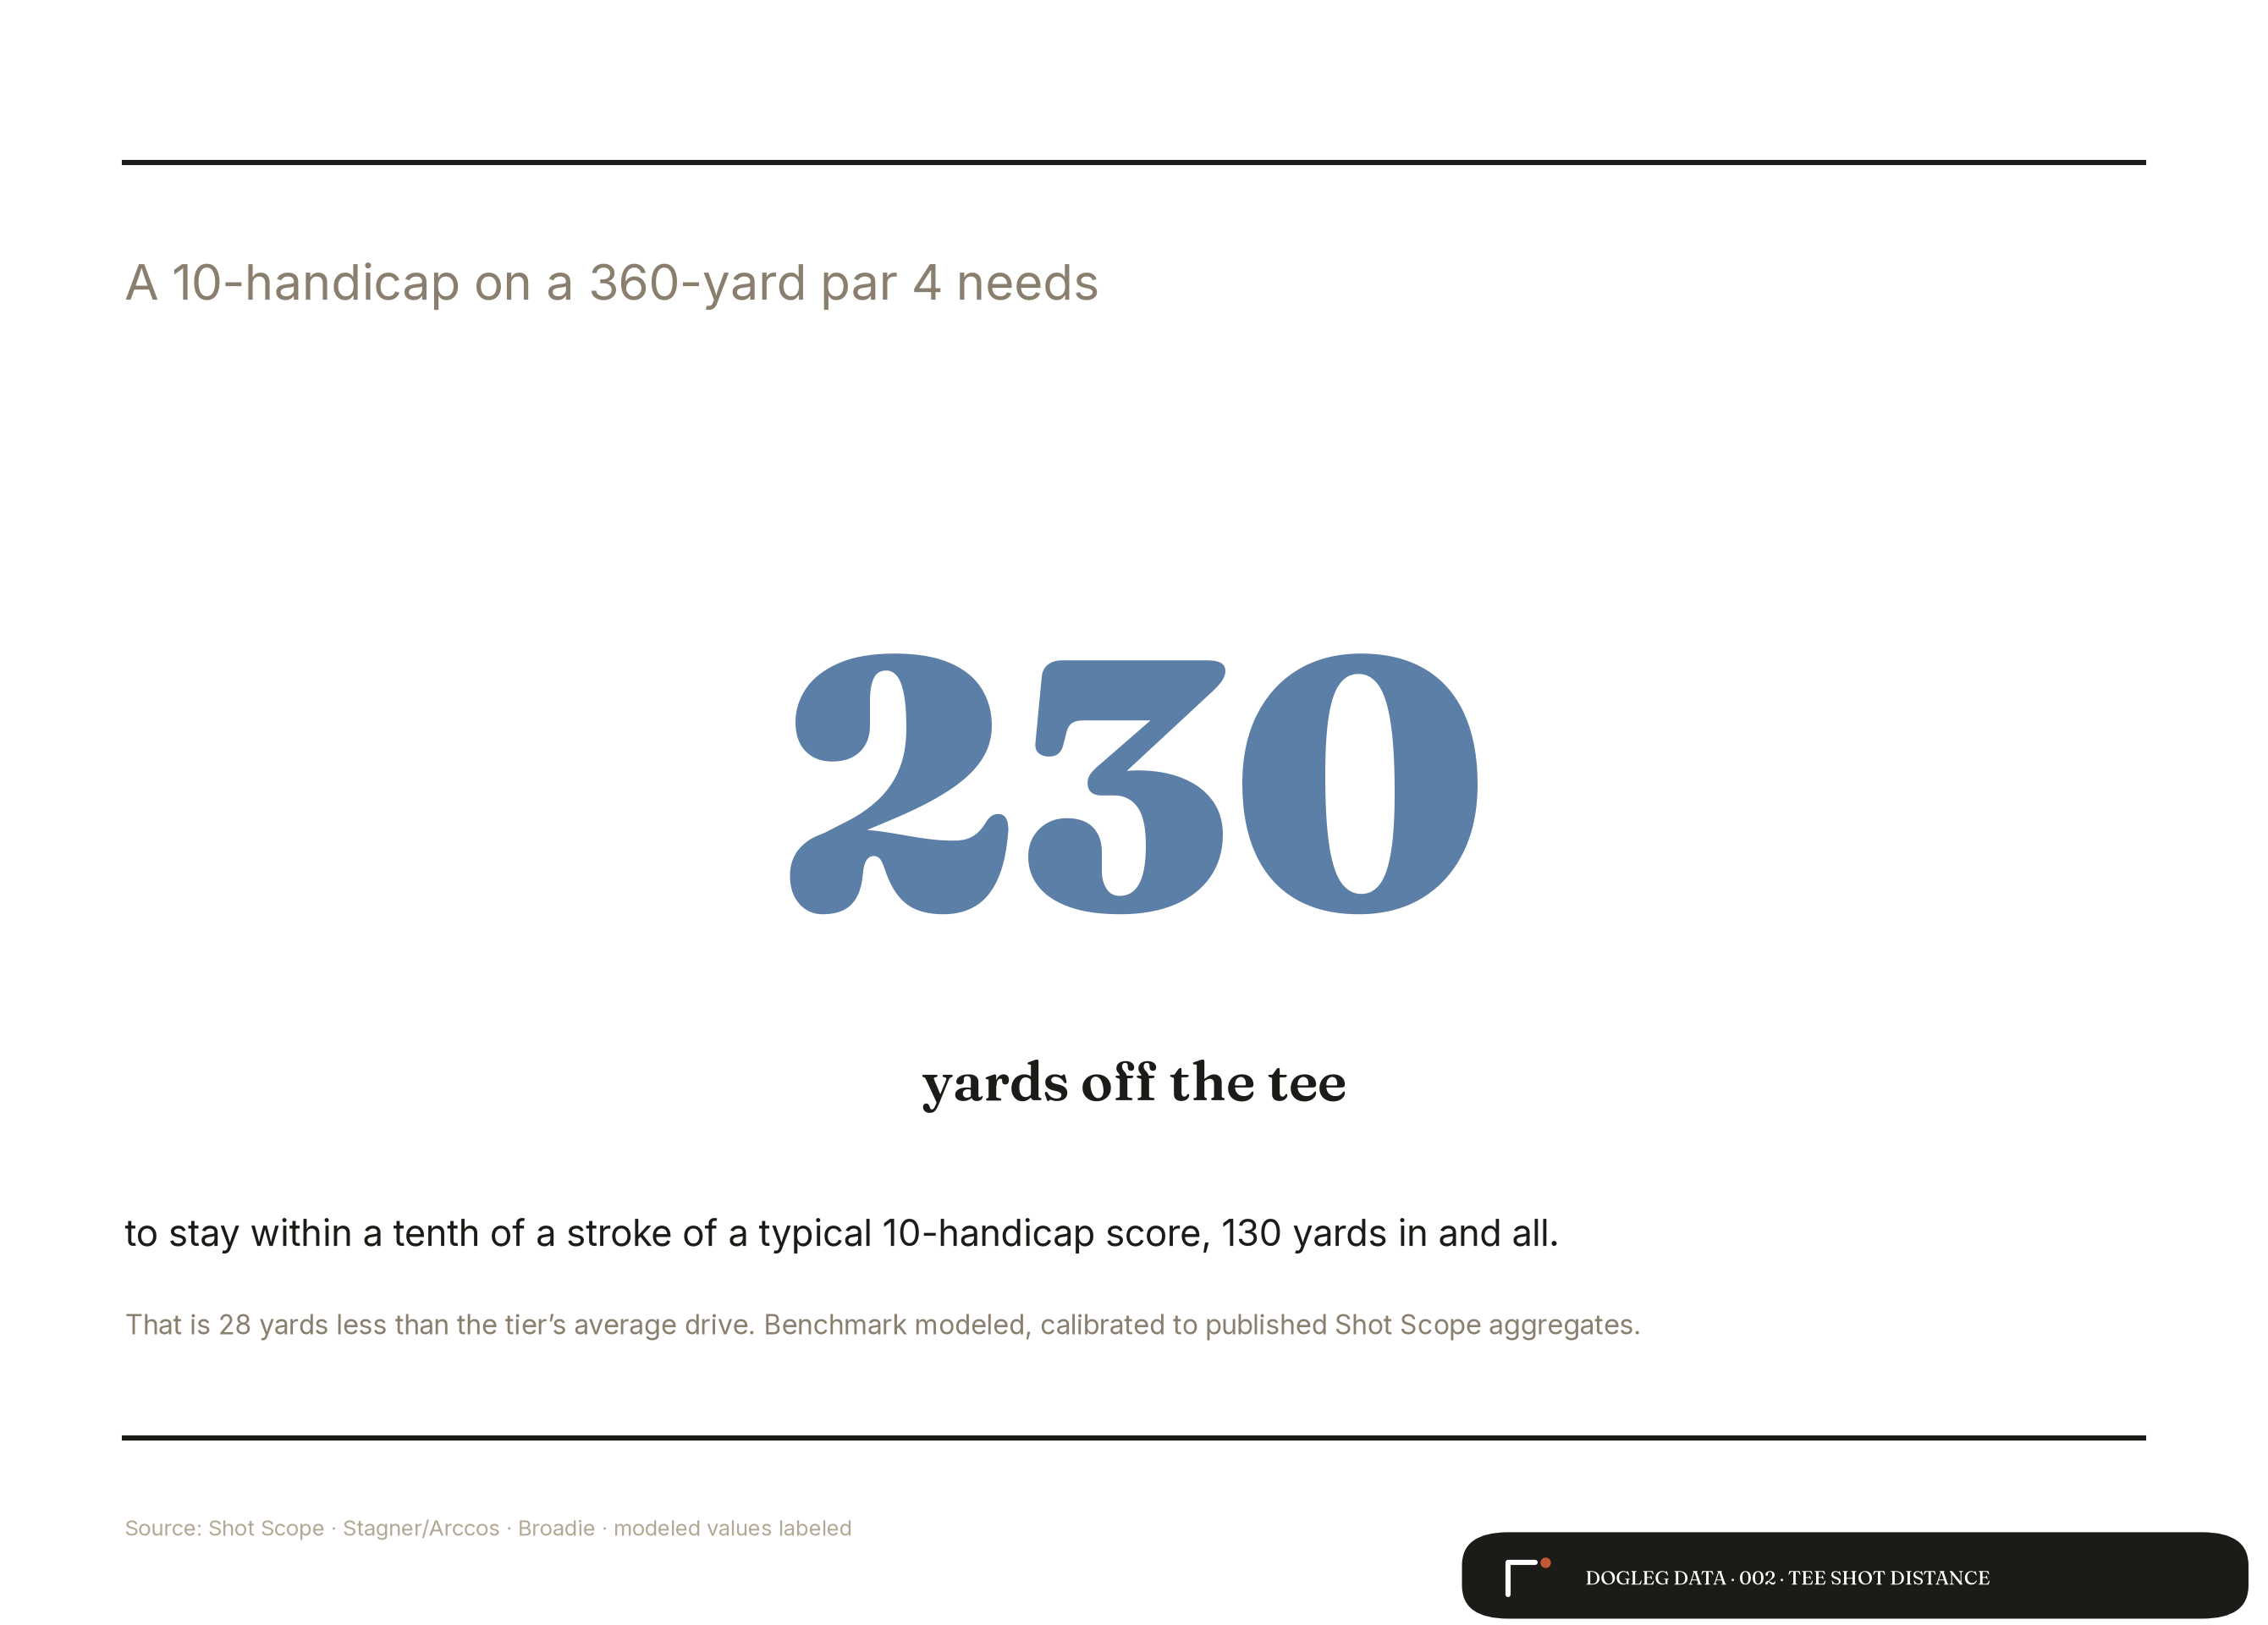
My model never saw those numbers. It runs on Shot Scope's published aggregates, and under their exact setup, drive in the fairway, strict zero strokes gained, it answers 228 for scratch and 208 for the 10-index. Two yards apart on one, eight on the other, from a different dataset and a different method.
The rest of this analysis prices the misses too, which is why the cost line sits above the fairway-conditioned break-even. The distance bases differ as well: Shot Scope's mishit-filtered averages run about 25 yards longer than Arccos medians. The rule survives both framings. Theirs: about 30 yards under your average drive. Mine: 22 to 29 under, at the cost line.
Your average drive lives past the line
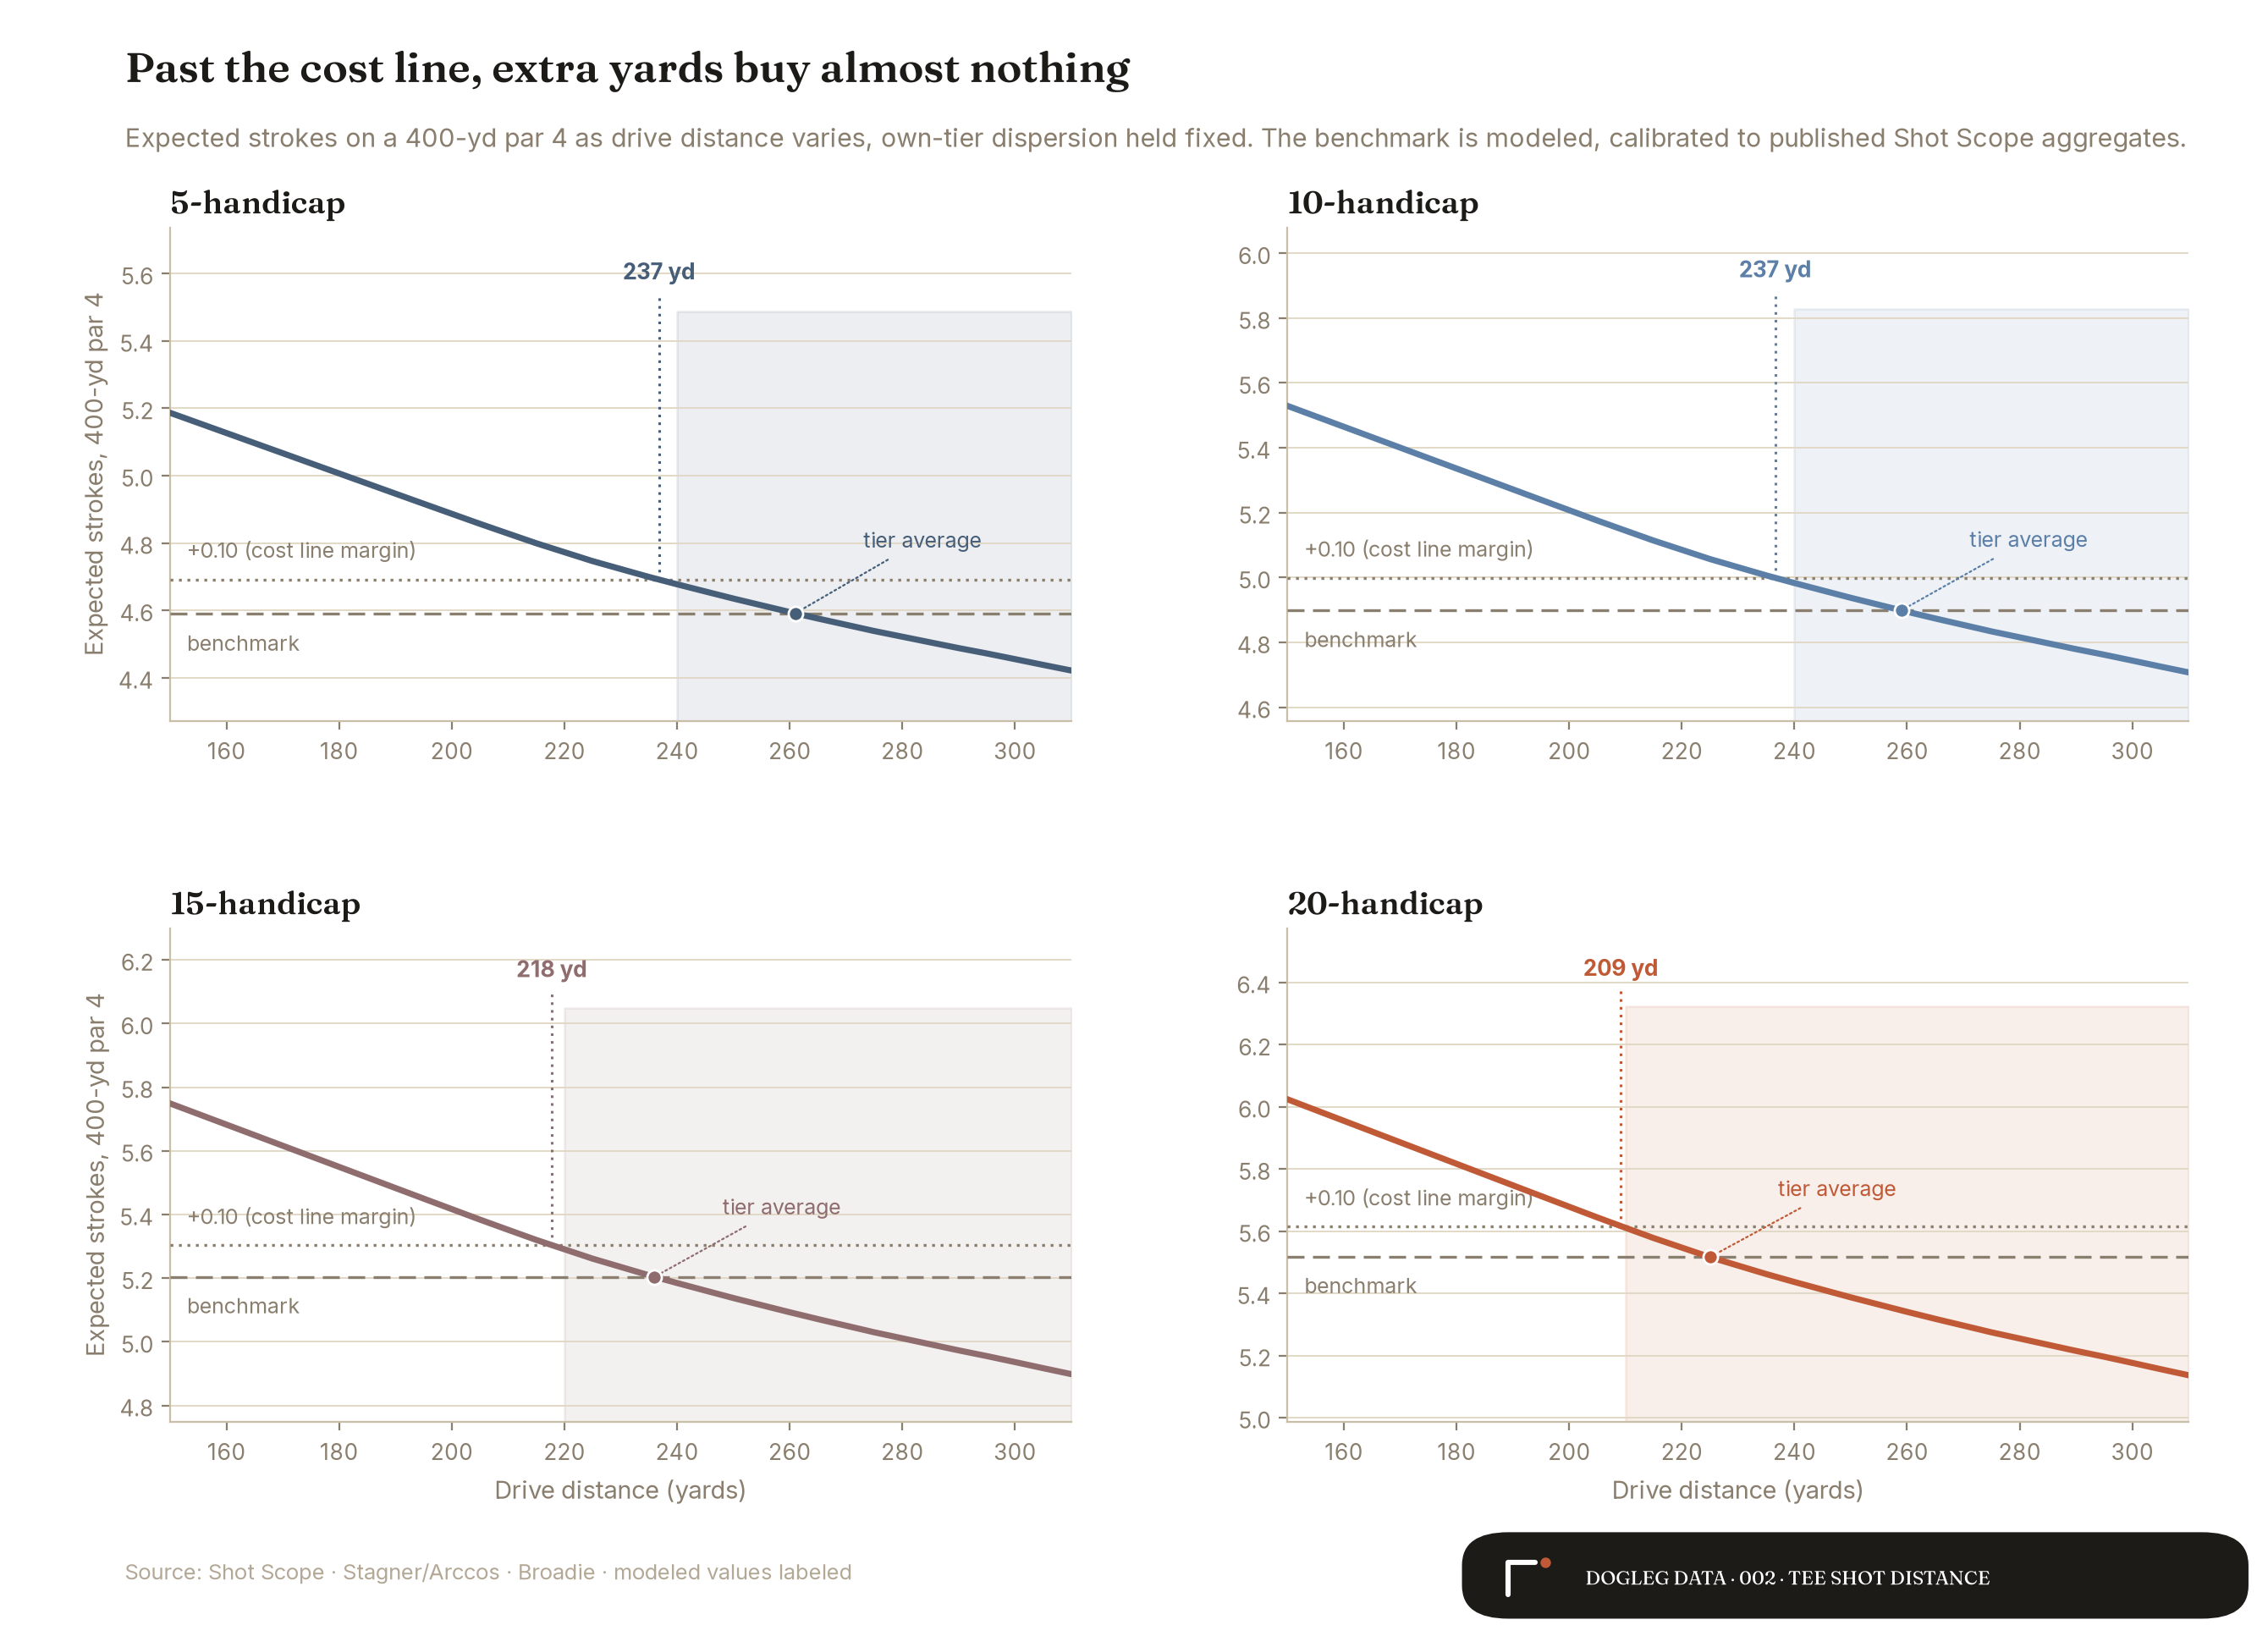
Chart 2 shows the same fact as a curve. Expected score falls as drives get longer, then flattens, and the shaded zone marks every drive distance that keeps the hole within a tenth of a stroke of your benchmark. The headroom runs from 24 yards for a 5-handicap down to 16 for a 20. Give back that many yards off your average and you still lose less than a tenth of a stroke.
The 180-yard approach, priced
My doubt going in was the second shot. A short drive looks cheap at the tee, and then you stand over 180 in. I expected the real bill to show up there.
It does, all of it. When a 15-handicap drives 220 instead of their usual 236 on a 400-yard hole, the cost is 0.09 strokes, and every hundredth of it is the longer approach. The lie mix doesn't move, because with the same club in your hands, a shorter carry buys no fairways. Shot Scope's published accuracy numbers back this up: fairway-hit rates hold between 46 and 49 percent from scratch to 25-handicap.
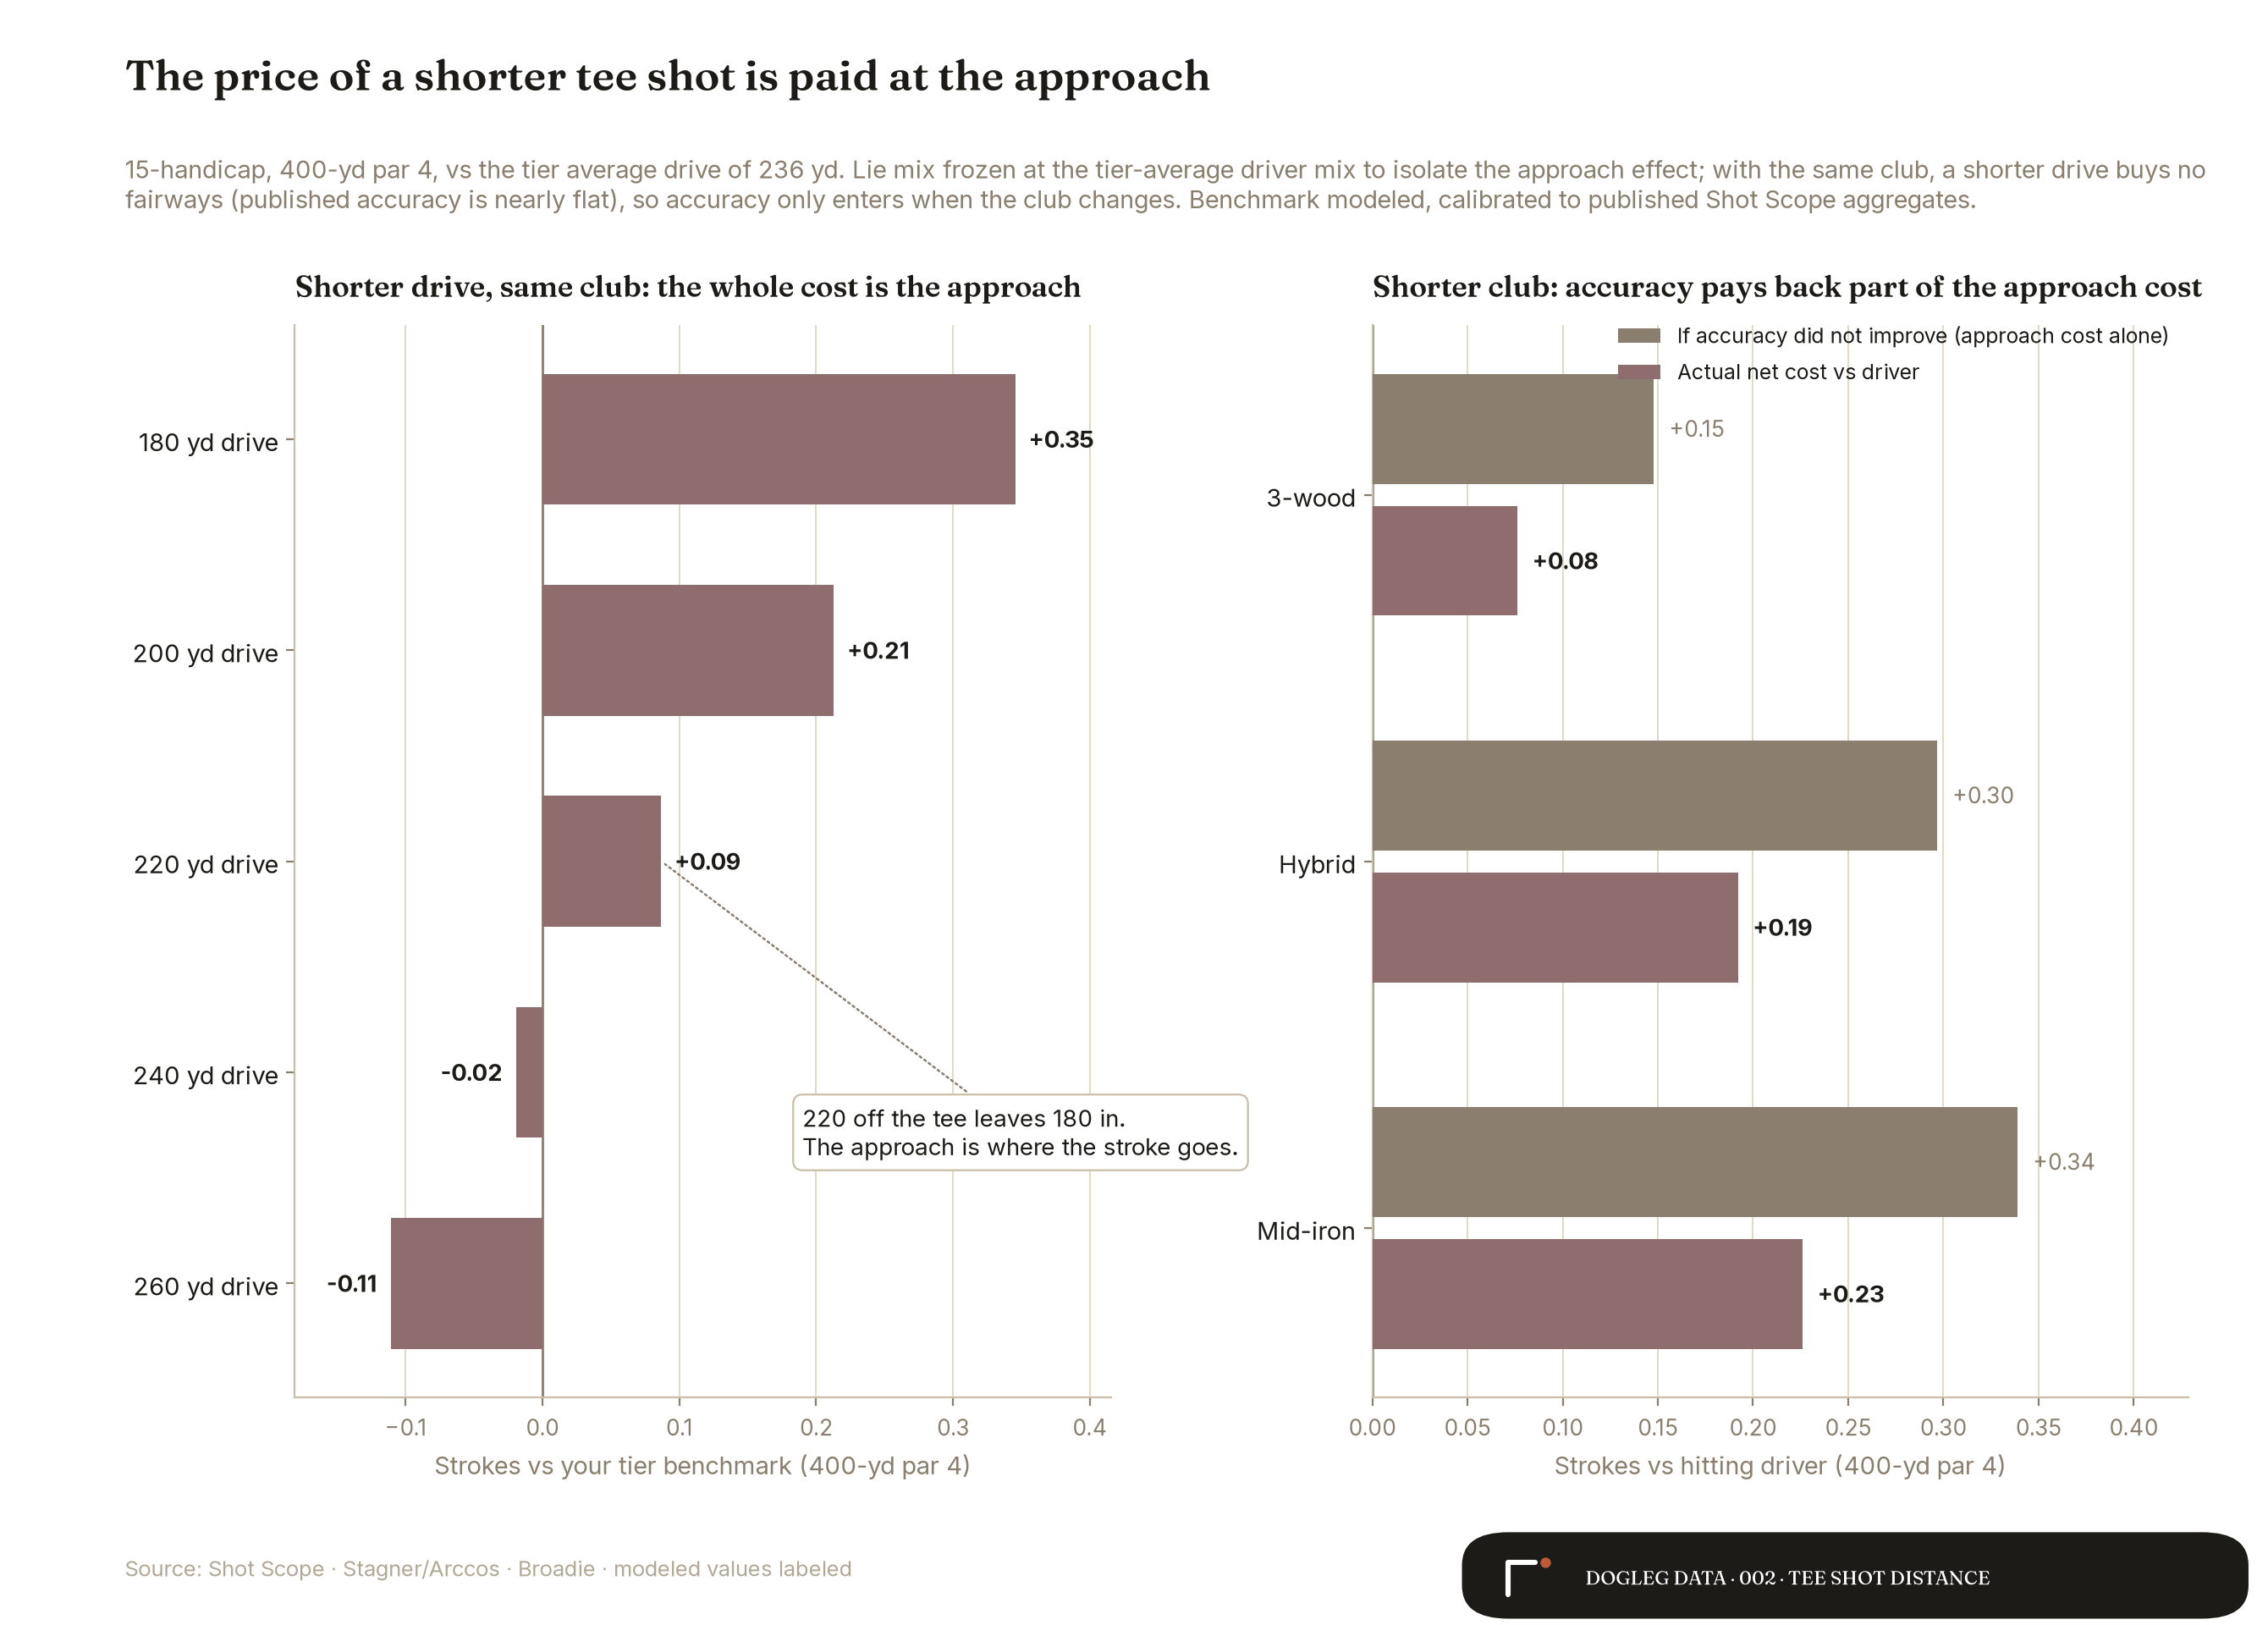
Accuracy enters when the club changes. The 3-wood gives up 0.15 strokes of approach position and buys back 0.07 of it in tighter misses, for a net cost of 0.08. That trade is the real driver-versus-wood question, and it turns out to be pocket change.
Squeeze the fairway and the club changes
Every number above holds at Stagner's published 36-yard fairway, and nothing moves above that width. Below it, the model prices what makes a narrow hole narrow: the tighter the corridor, the more of the miss zone plays as out of bounds, water, or trees instead of rough. The OB share ramps from zero at 36 yards to full at 16, and the rough band thins to matchmodeled.
A 25-yard fairway costs a mid-handicap golfer about 0.37 strokes on a 400-yard hole, and a corridor that tight plays over your usual number at any drive distance. The bigger news is the club call. At tier-average distances, every handicap starts clubbing down on some holes once the fairway drops into the low 30s, and by the low 20s the wood or an iron takes the tee on short holes. Crossfield measured his home course's landing gap at 25 yards on the same episode; the width control is for that hole.
Widen the fairway to 45 yards and you get back about 0.05 strokesmodeled. The benchmark stays at the published 36-yard width, so a tight fairway shows up as strokes lost against a fixed goalpost, which matches how the hole plays.
Your par 4, your handicap, your drive.
The calculator behind this post is the working model. It takes your fairway width too, and returns your expected score, your strokes gained against your tier, the cost line for the hole, and a driver-or-backup call for the club you trust.
Open the calculatorThe club off the tee is a rounding error
Chart 4 runs the driver-versus-3-wood trade across the full grid, seven tiers by ten hole lengths, at the standard 36-yard fairway. The driver wins every cell on average, and it never wins big. The worst case anywhere is 0.12 strokes, on the longest holes for the tiers that hit it far enough to exploit them. For a 25-handicap on a 320-yard hole, the 3-wood costs 0.02.
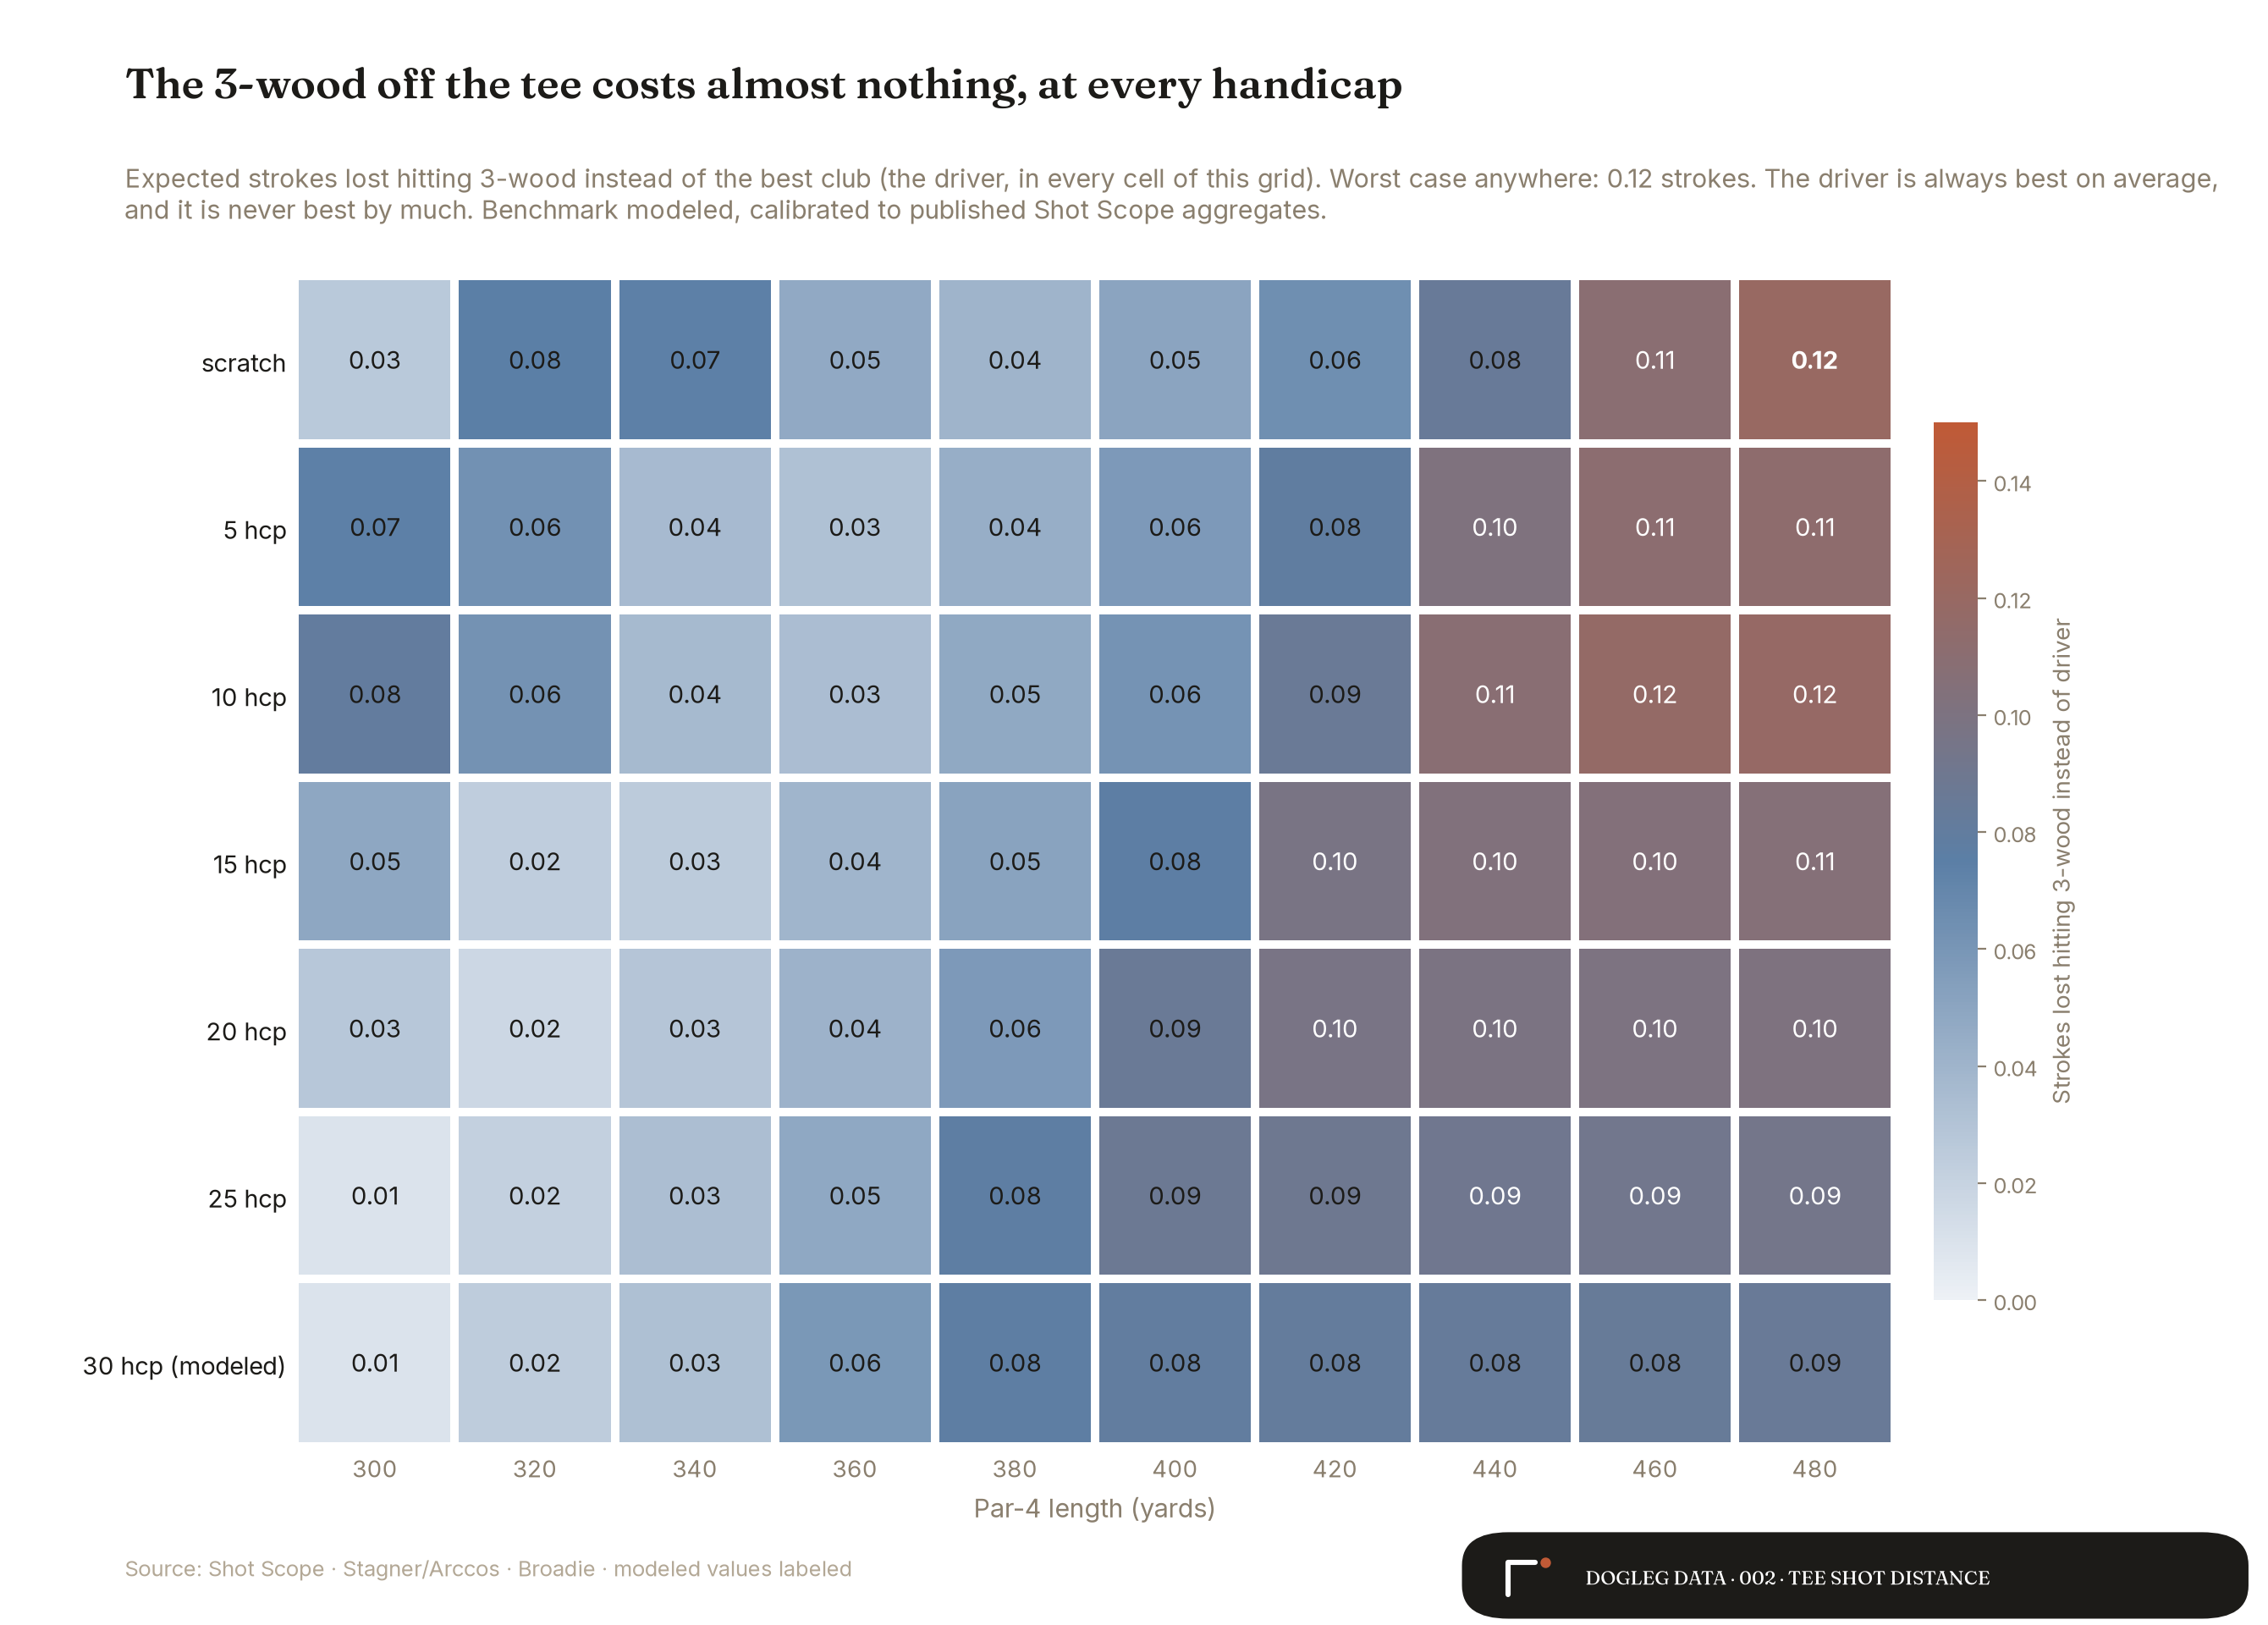
So the honest club advice is boring: hit the one you trust. The scorecard cost of the safe club is an eighth of a stroke at worst, and confidence over the ball is worth more than that. Irons are a different story. A 4-iron off the tee costs a 15-handicap 0.23 strokes on a 400-yard hole, a 7-iron costs 0.39, and neither ever wins a single cell of the grid. On a straight par 4 with no forced layup, the iron hands strokes back.
The move
Four questions kept coming back, in the episode and in the replies to release 001. The model answers all four.
Do you hit driver on most par 4s? Yes, at any normal fairway width. The driver wins every tier-by-length cell on average. The longest club you can keep in play is the right call, and your average drive already clears the cost line everywhere. Scott Fawcett's DECADE system preaches this, and Shot Scope's scoring data backs it: longer drives on a hole go with lower scores. A fair objection is that the raw scoring tables mix the trouble in with the good drives and cannot tell you how many punch-outs and penalties hide inside those averages. So this model charges the trouble up front: every driver swing here carries a 14-to-15 percent chance of a punch-out, drop, or penalty, the same range as Arccos's published 17-to-25 percent trouble rates. Even with that charge included, the driver wins.
Is the 3-wood ever worth it off the tee? On an open hole, no. It runs 0.05 to 0.09 strokes behind the driver on a 400-yard hole, depending on tier, and its tighter dispersion never pays back the full distance it gives up. The studies you have read saying the 3-wood is a placebo hold up in this model, with the caveat Stagner raised on the episode: about one golfer in four is much straighter with the 3-wood than the driver, and for that quarter the tight-hole switch is real. The calculator's backup-club input is there for them. That caveat leads to the next question.
So when does the safe club pay? When you hit OB with the driver on drives the safe club would keep in play. Price it: an out-of-bounds drive costs about two strokes. For a 15-handicap on a 400-yard hole, you break even on the 3-wood once the driver puts you OB one extra time every 26 driver holes. A 20-handicap breaks even at one every 23. Call it 14 tee shots a round: if you lose an extra ball about once every two rounds with the driver, the 3-wood pays on the holes where the trouble lives. Lose one a season and you keep hitting driver.
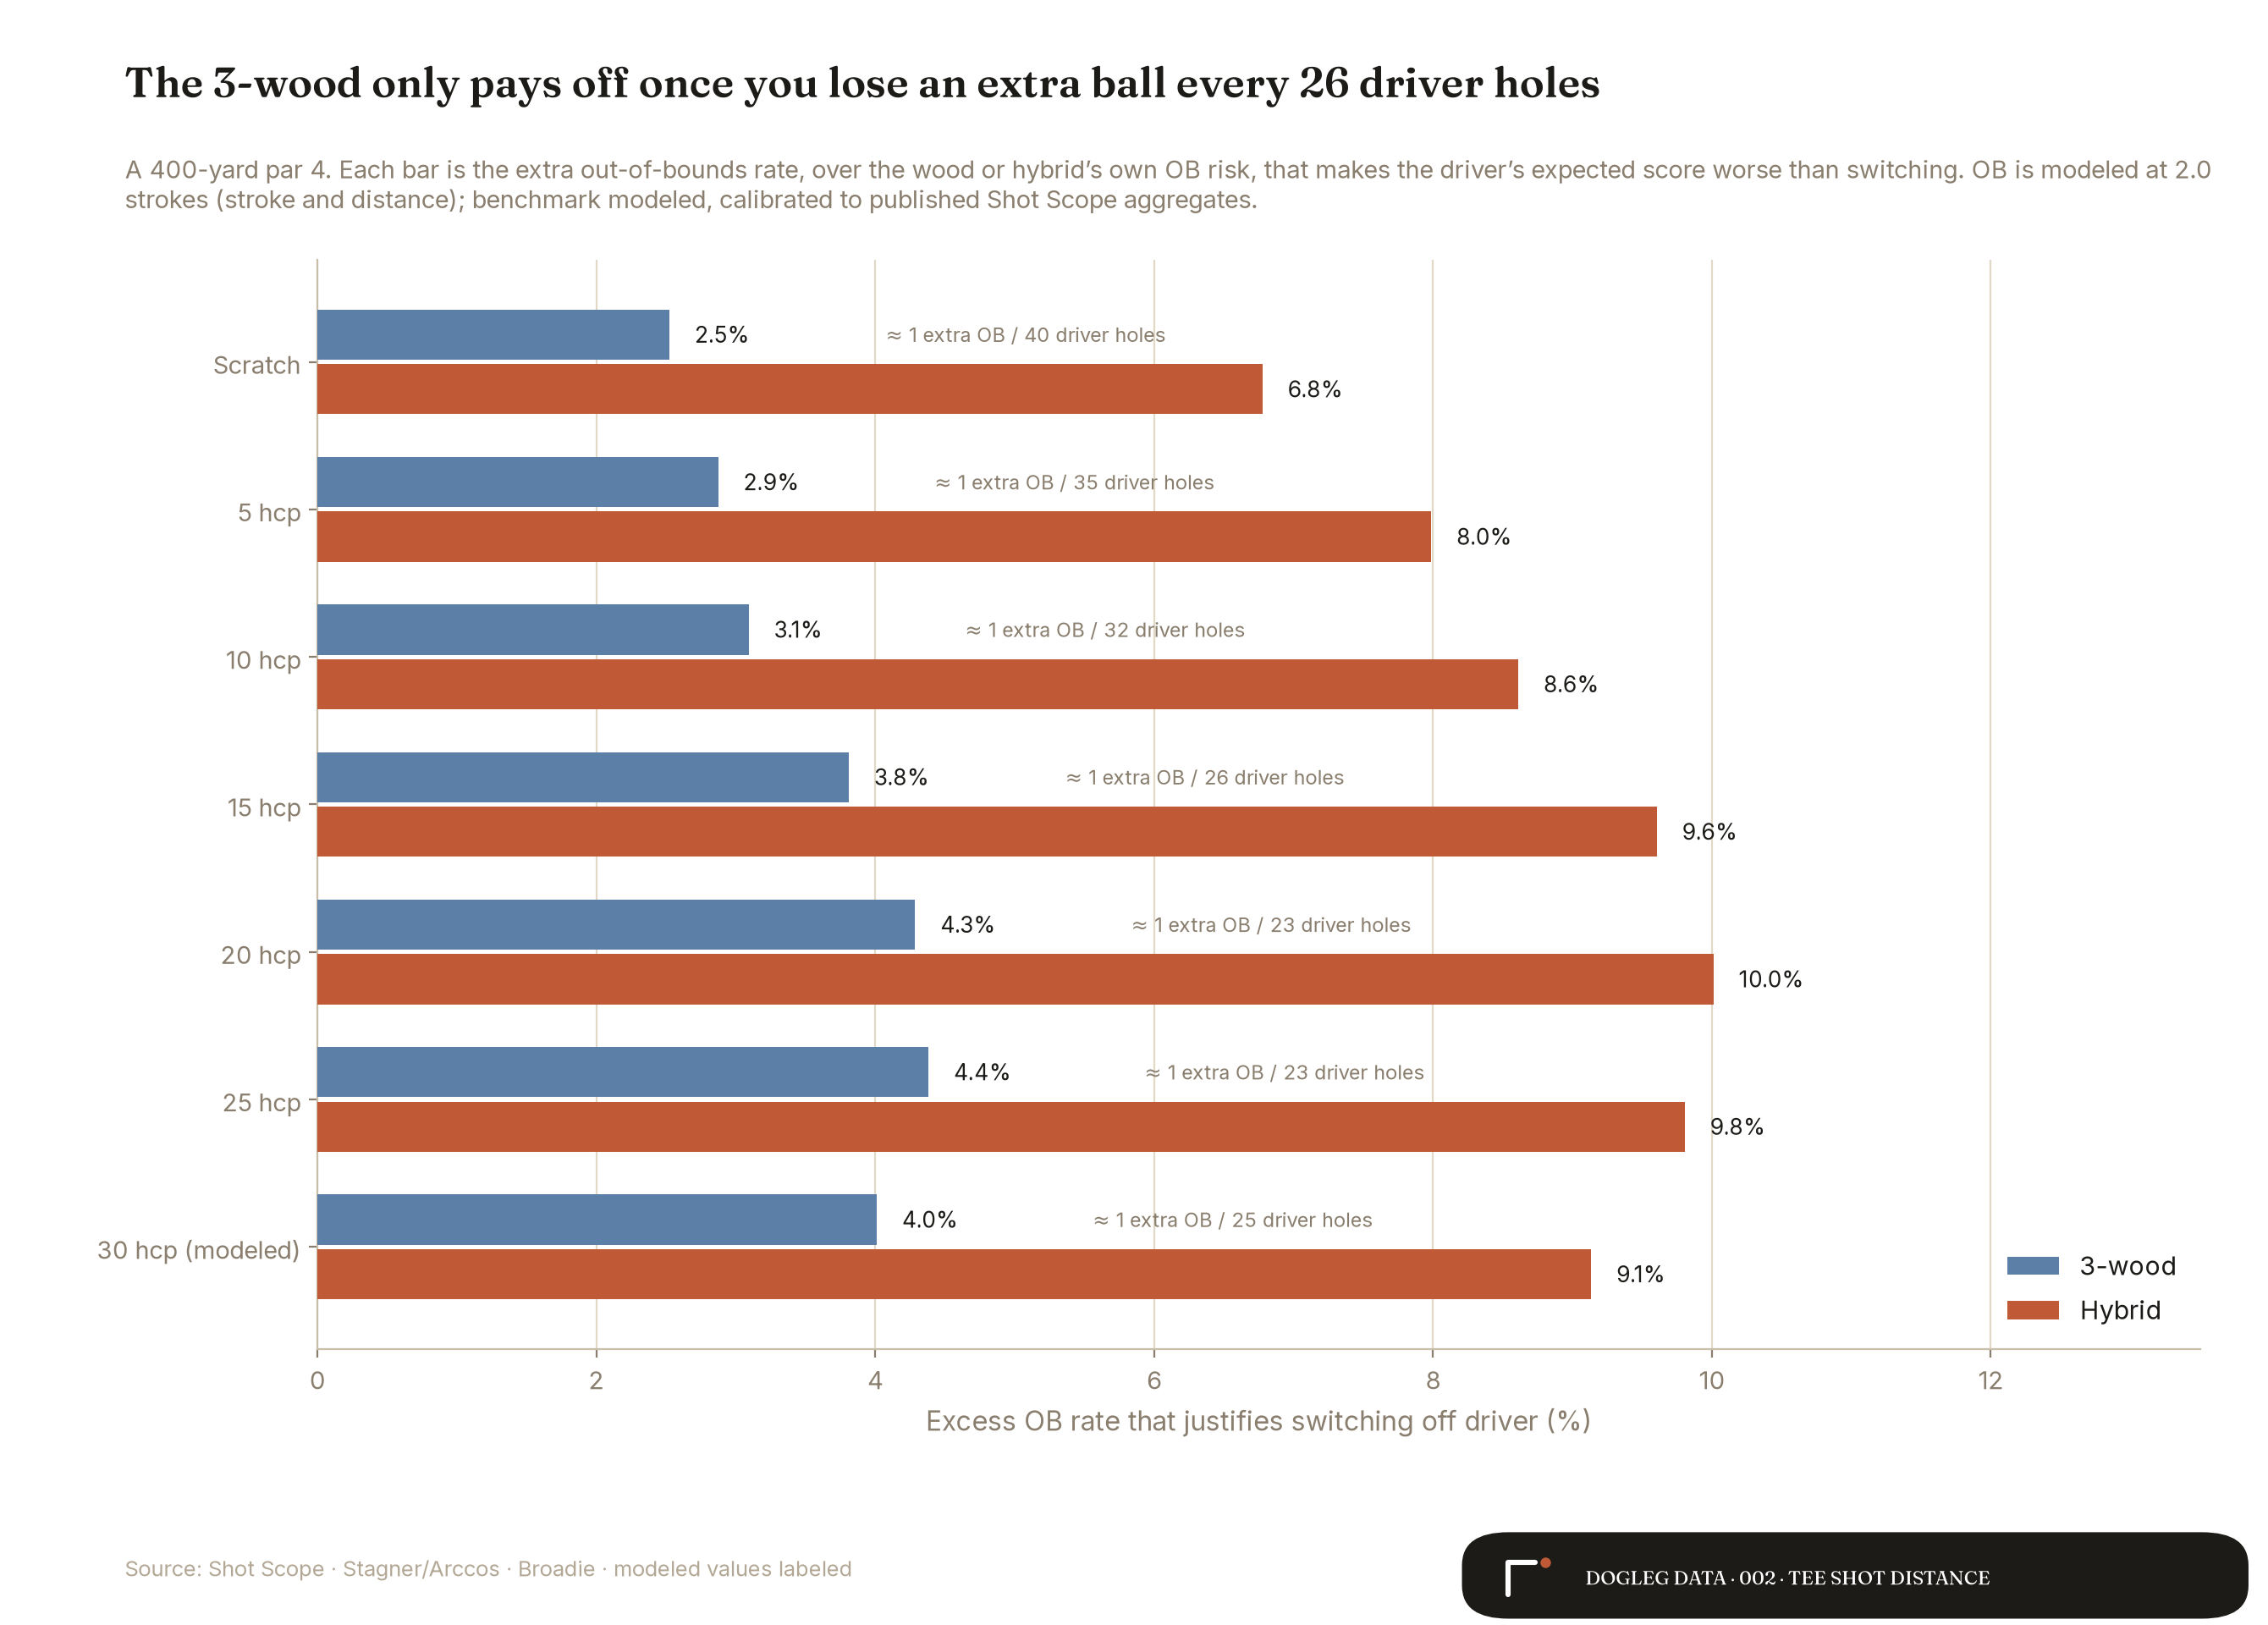
Should you build a thriver or buy a 5-wood or 7-wood for the tee? Run the same test. A 5-wood or 7-wood sits between the 3-wood and hybrid rungs, so its break-even sits between one extra OB every 23 and one every 10 driver holes at mid handicaps. Count your last ten rounds. If you went out of bounds with the driver five or more times on drives the wood would have kept in play, pull the wood on those holes. One OB all season? Keep swinging the driver and stop shopping.
What this does not say
Two cautions before you screenshot chart 5 at your longest-hitting friend. First, distance still separates tiers. Scratch golfers drive it 285 and 25-handicaps drive it 204 in Shot Scope's data, and that gap is part of why their benchmarks sit four strokes apart on a 400-yard hole. This analysis holds your skill fixed and asks what one hole demands of it; it does not claim distance is worthless in the long run.
Second, the benchmark here is modeled. No published table of par-4 score by hole length by handicap exists, so the model calibrates its own: its expected scores, averaged across a par-4 length mix, reproduce Shot Scope's published average par-4 scores at all six published handicap bands to within 0.0001 strokes, and a Monte Carlo harness agrees with the analytic model within 0.003 strokes. The 30-handicap tier, the length resolution, the mishit rates, and the trouble costs are all modeled, and every chart says so where they appear.
Sources
- The question
- Hack It Out Golf, Saturday Morning Golf Stat: "SMS: 400 Yard Hole, Drive Length for 0SG, Scratch and 10" (Jul 3, 2026), with Mark Crossfield, Lou Stagner, and Greg Chalmers. The episode posed the question this analysis answers; its framing conditions on finding the fairway, this model prices the miss odds too. No transcript is public, so nothing here quotes the episode beyond its published show notes.
- Out-of-bounds cost
- Each OB drive is priced at 2.0 strokes, the standard stroke-and-distance rule of thumb; the bailout thresholds scale with that assumption across a 1.5-to-2.5 stroke sensitivity range. Below the 36-yard reference width, a growing share of the trouble zone is priced at the OB cost, reaching full OB pricing at 16 yardsmodeled.
- Driving distance, club distances, accuracy, and par-4 scoring by handicap
- Shot Scope performance-tracking data at six handicap bands (0/5/10/15/20/25), read via MyGolfSpy's published transcriptions; the primary Shot Scope pages render the tables as images. The 30 band is my least-squares extrapolation across all six published bandsmodeled.
- Fairway geometry and tee-shot targets
- Lou Stagner / Arccos, "Tee Shot Targets": the published 36-yard fairway and on-course dispersion patterns. Lateral dispersion per tier is derived by inverting Shot Scope's fairway-hit rates through that geometry, cross-checked against Broadie's published angular dispersionmodeled.
- Strokes to hole out by distance and lie
- Mark Broadie: the 2011 ShotLink tour curves and the 2008 Golfmetrics amateur tables (proximity and green-hit rates by distance, lie, and skill group). The per-tier curves between those anchors are constructed and calibratedmodeled.
- Benchmark calibration
- The model's expected scores reproduce Shot Scope's published average par-4 scores at all six published bands (max gap 0.0001 strokes). A Monte Carlo harness agrees with the analytic model within 0.003 strokes.
Take the cost line to the course
The calculator returns the cost line for any par 4 at your handicap, plus the strokes-gained verdict on the drive you hit. Built on the same data this post cites, source lines included.
Open the calculatorThink your course's toughest par 4 breaks the model? Send me the hole.
Send it on XThe break-even numbers, on one card.
Fairway-vs-rough break-evens at 100 to 175 yards, the scramble rule, and the 240-yard crossover. Sources named, modeled figures starred. Get the card now and Analysis Nº 003 when it survives review.