Every chart here is yours to use, with credit.
Covering a question these numbers answer? Take the chart. Each one carries its own source line and the credit on the image, so it works as-is in show notes, on screen, or in an article. No permission needed.
Credit rules
- Credit "Dogleg Data" and link doglegdata.com (the badge on the chart already does the naming if you keep it visible).
- Keep the source line and any "modeled" labels on the image. They mark which numbers are published data and which are extrapolated, and cropping them changes the claim.
- Want a number checked, a custom size, or a scramble read run through the model? Email sunny@doglegdata.com. Same-week turnaround.
Boilerplate
Dogleg Data tests golf's conventional wisdom against real data at every handicap, with every source cited and every modeled number labeled. Built by Sunny, a data analytics professional, it publishes the charts and the models behind them under one tagline: play the percentages.
Chart pack · Face, Path, and the Ball Flight Laws, in Numbers
The citable stat: in the Dogleg Data flight model, 83 percent of a Tour driver's start direction comes from the face and 73 percent of a 6-iron's. Label it modeled. The range image below covers the piece; the live figures run in the article and the Ball flight lab.

Chart pack · Where to Aim at Augusta's 12th, Pin by Pin
The citable stat: the 12th at Augusta National plays 155 yards over Rae's Creek, and two of its three pins are safe to attack at every handicap. The back-right Sunday pin isn't. The hero image below covers the piece; per-chapter cards for social use live in the launch kit.

Chart pack · How Far Do You Need to Hit It?
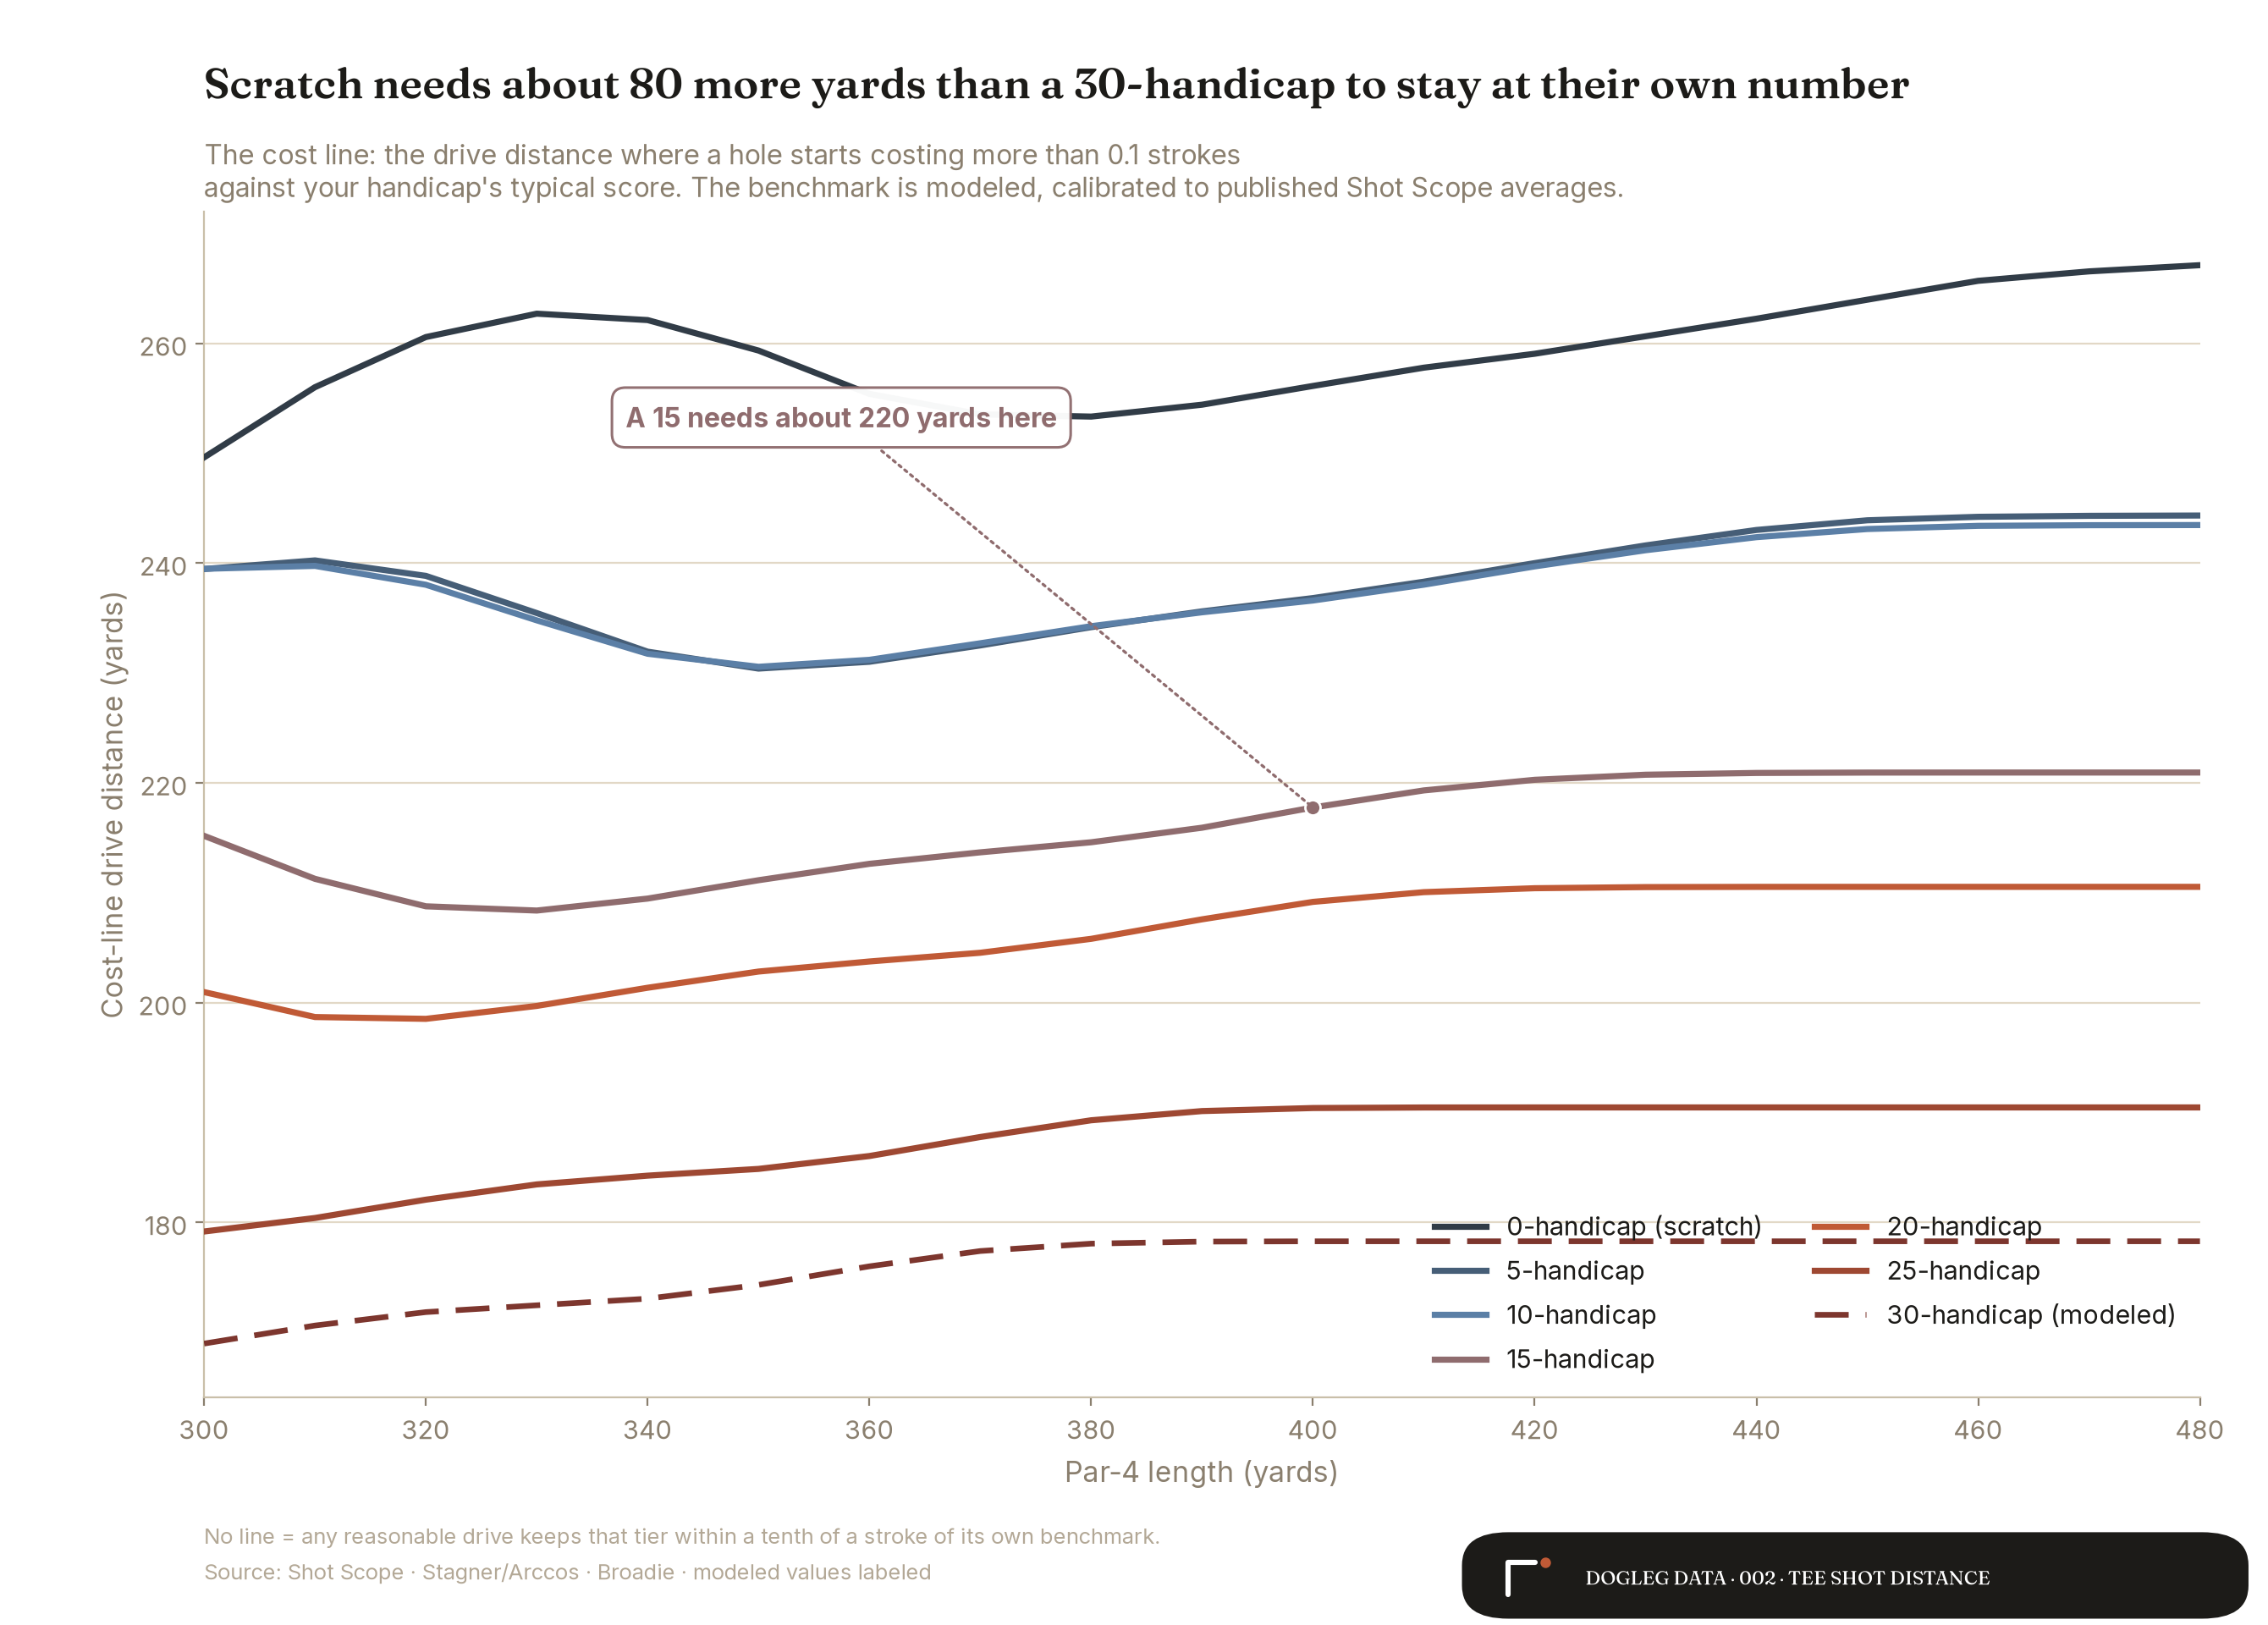
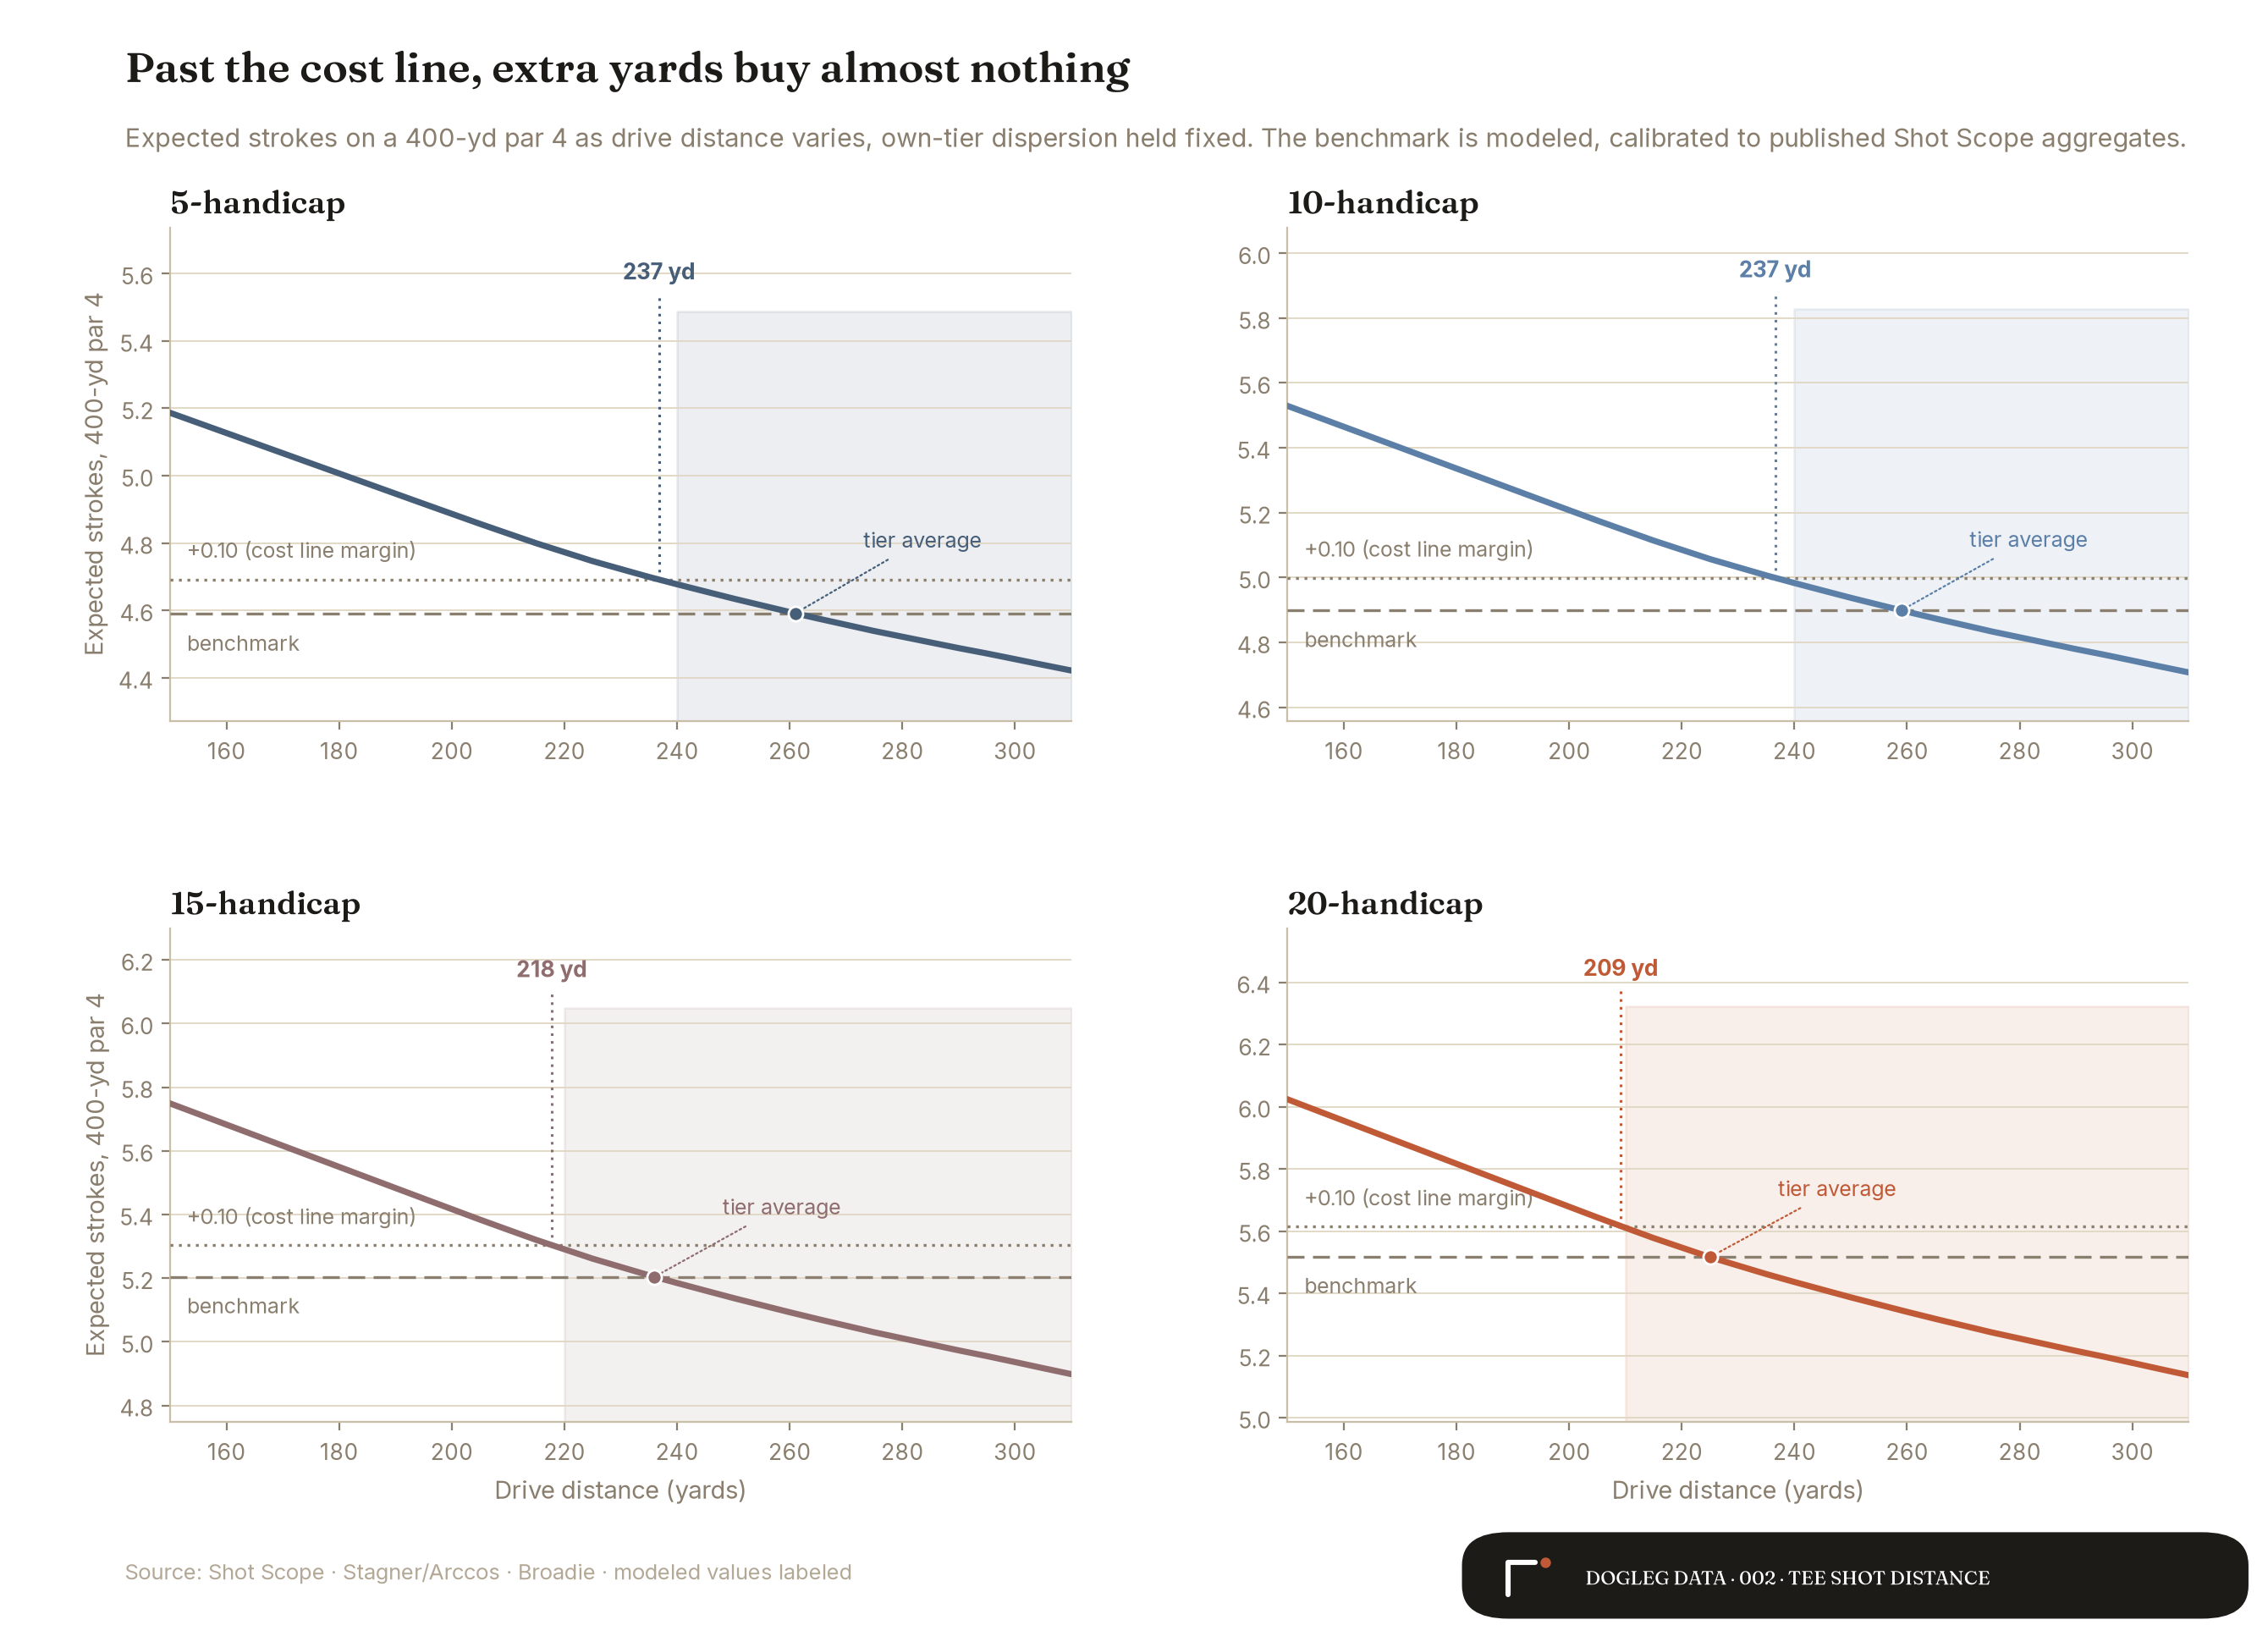
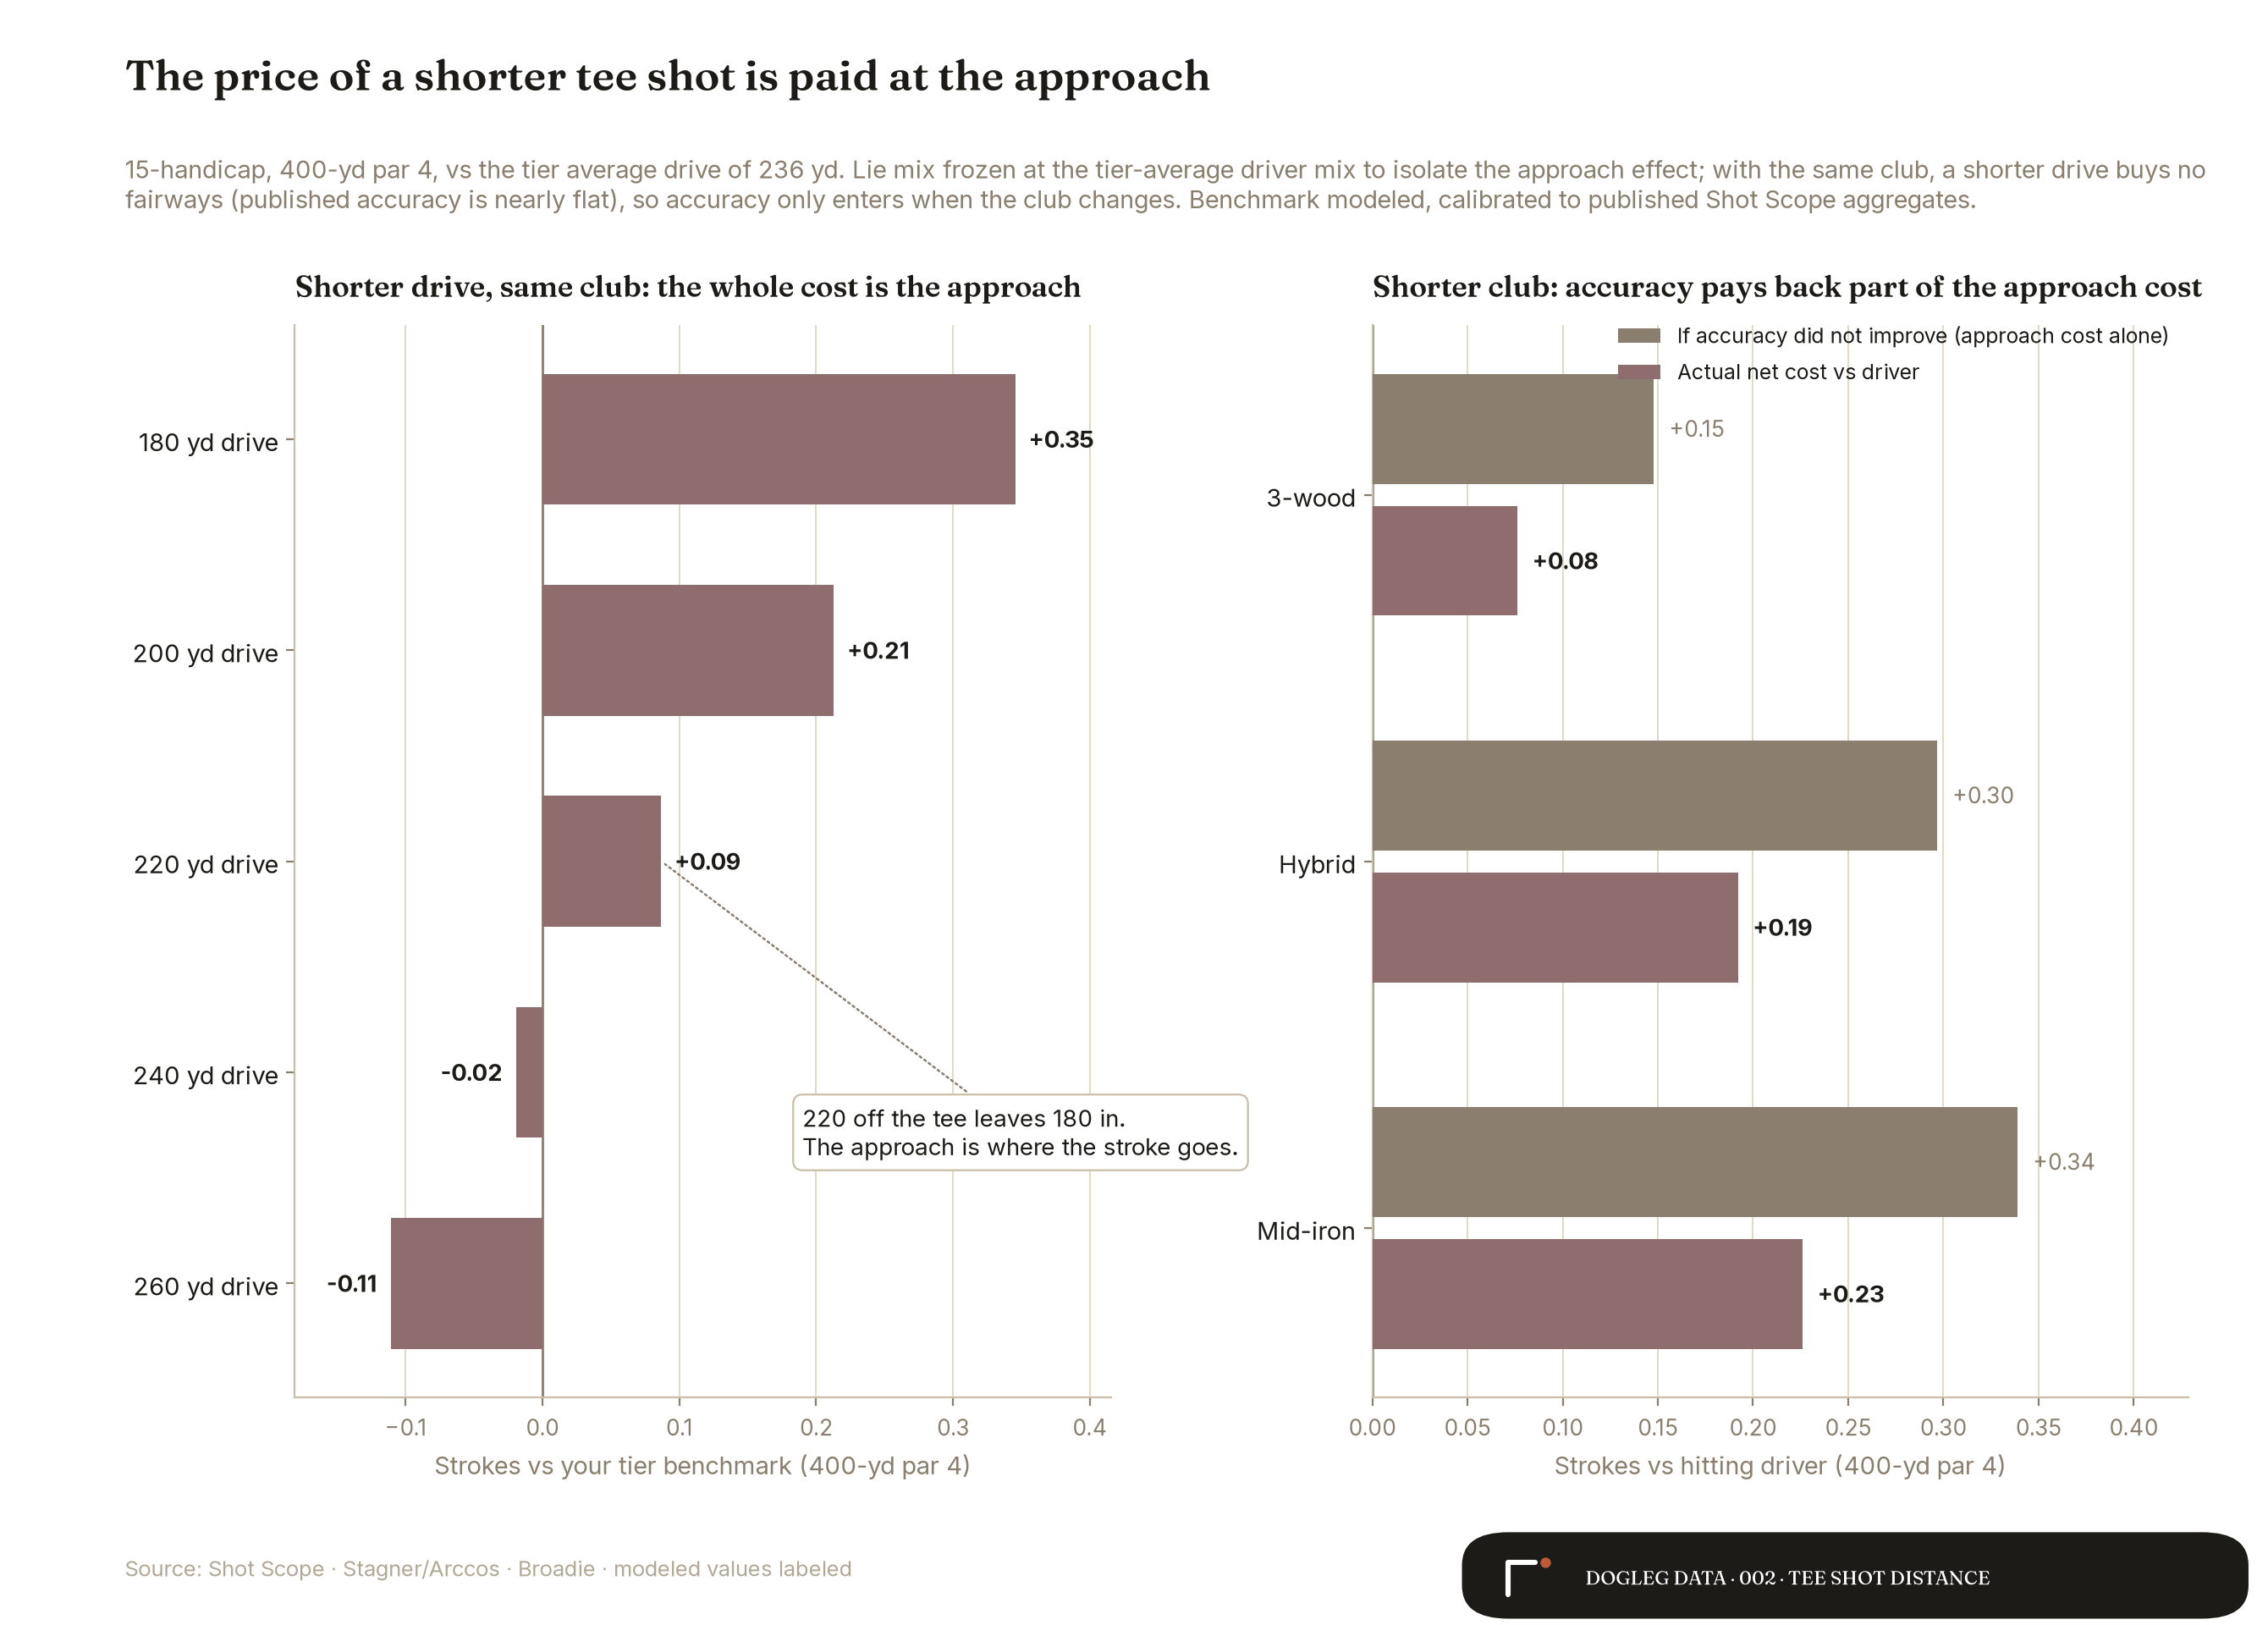
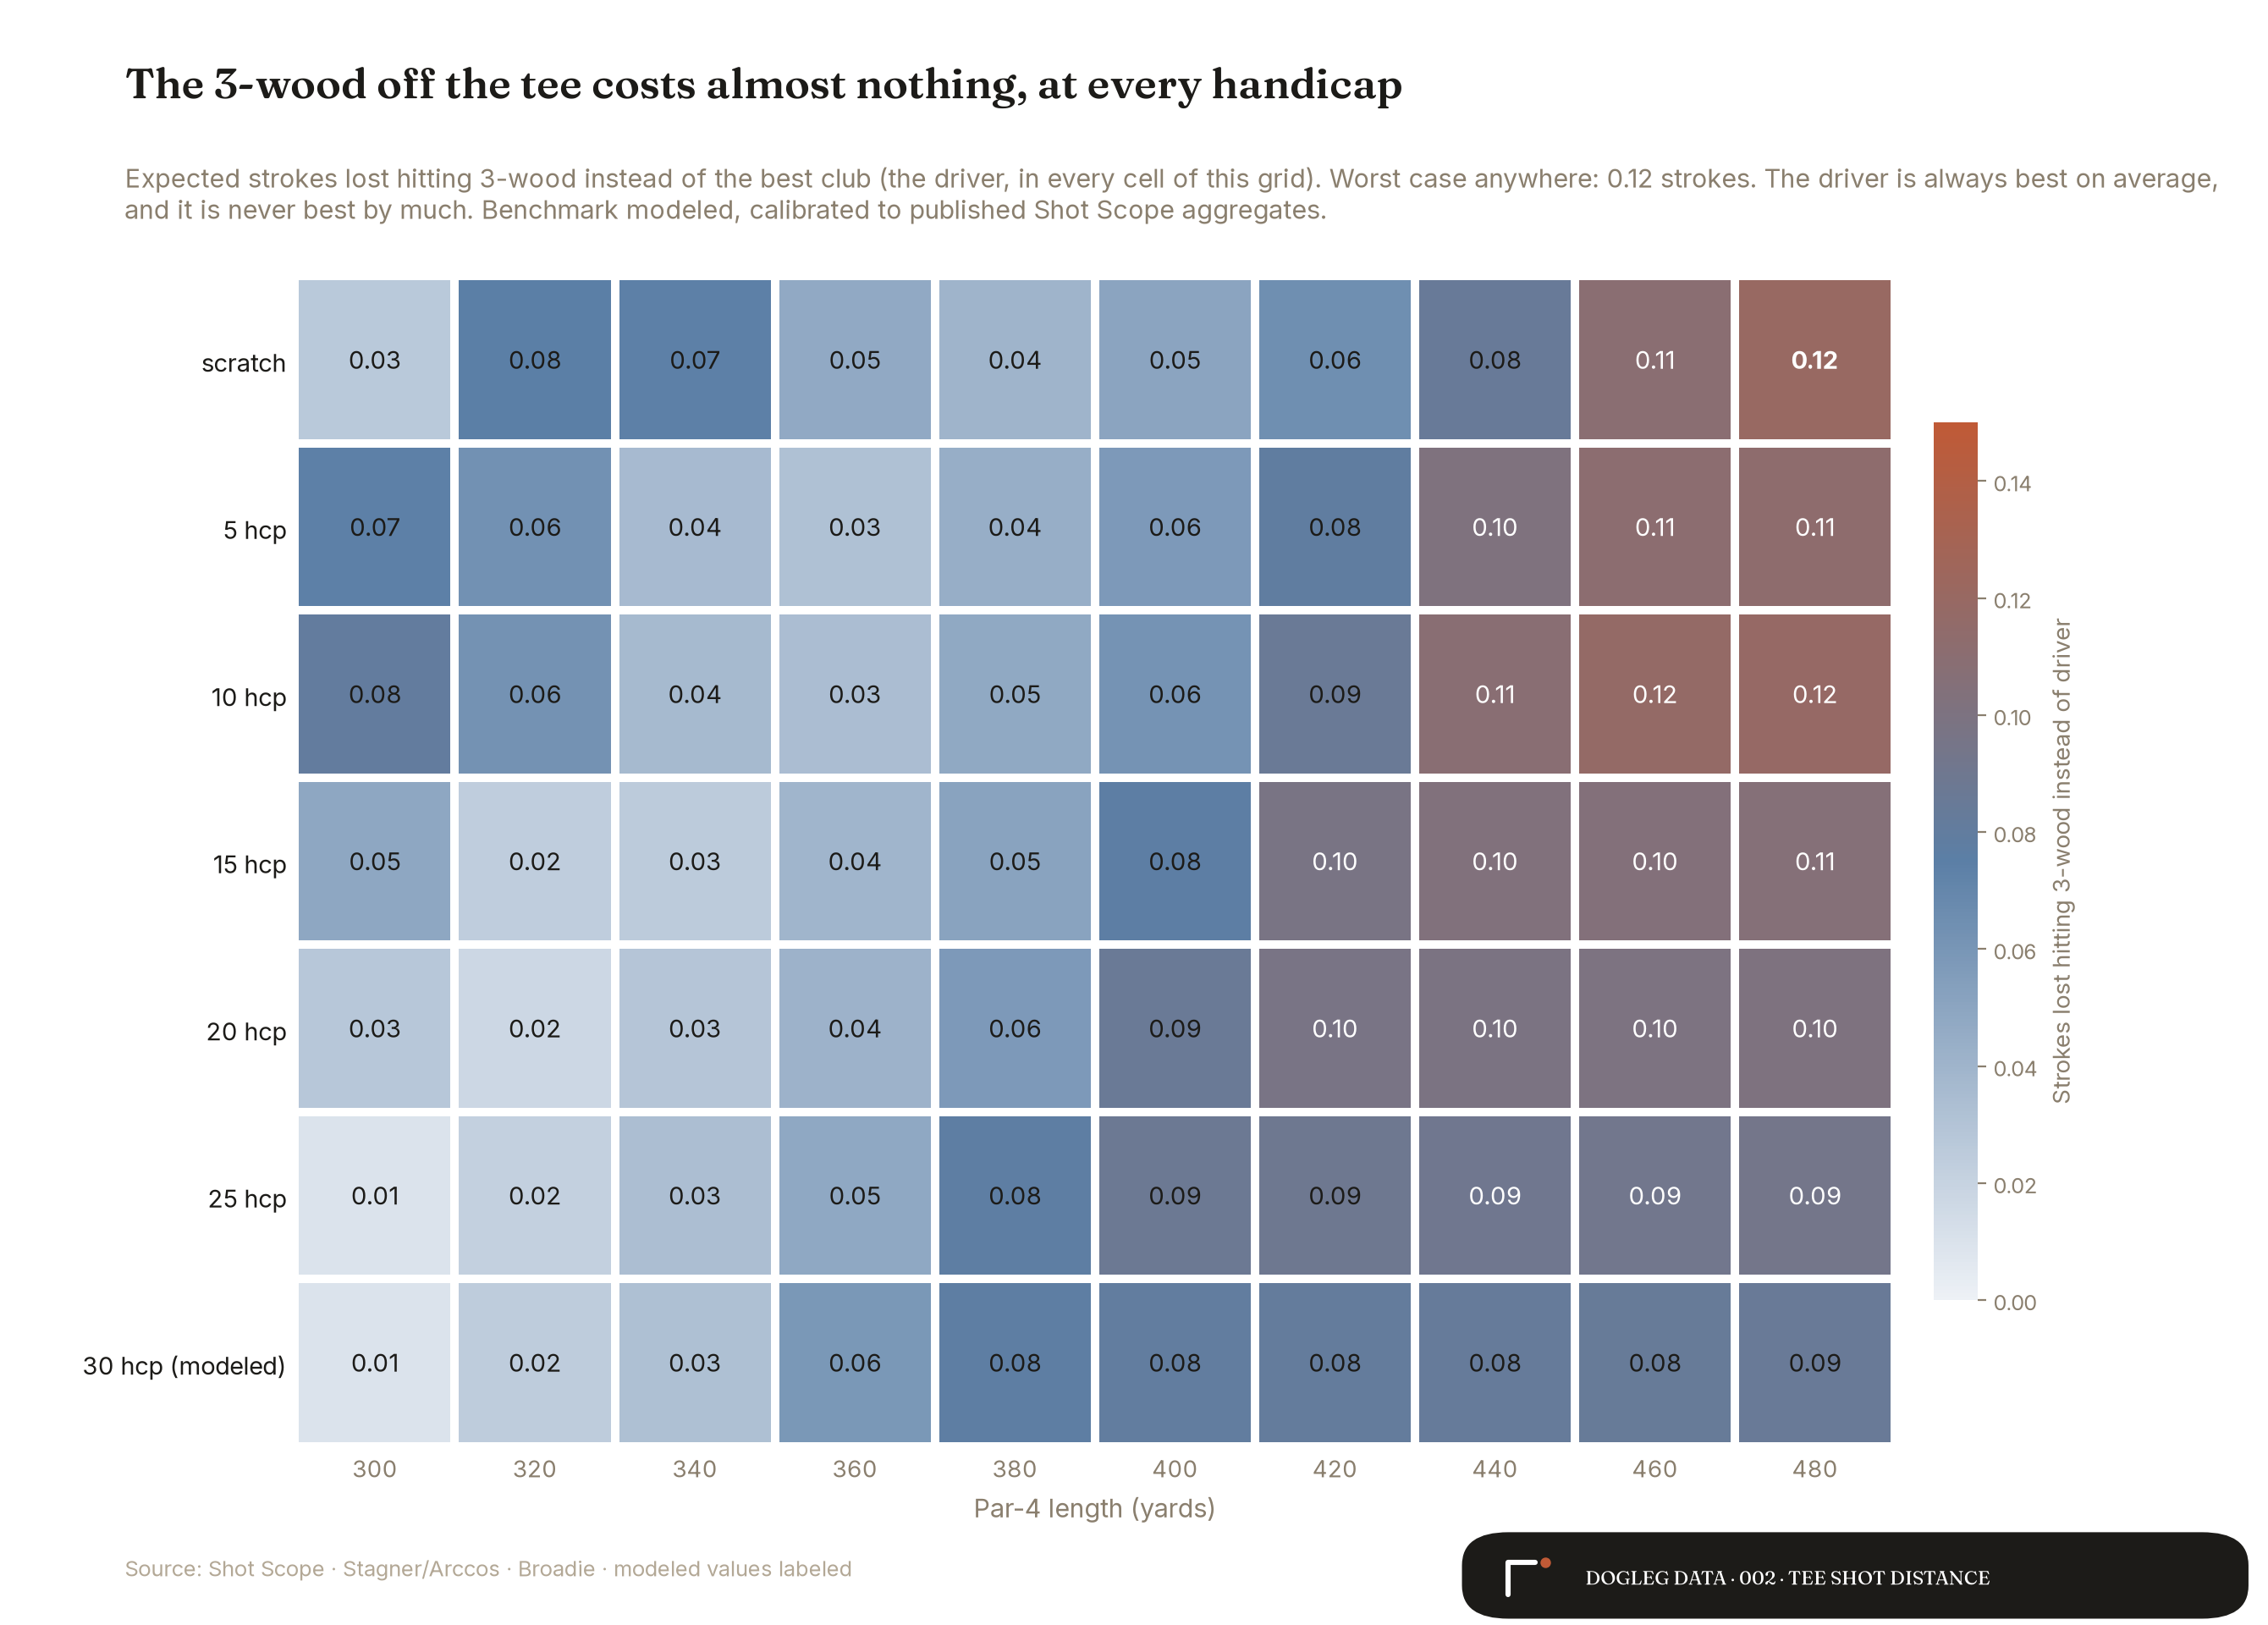
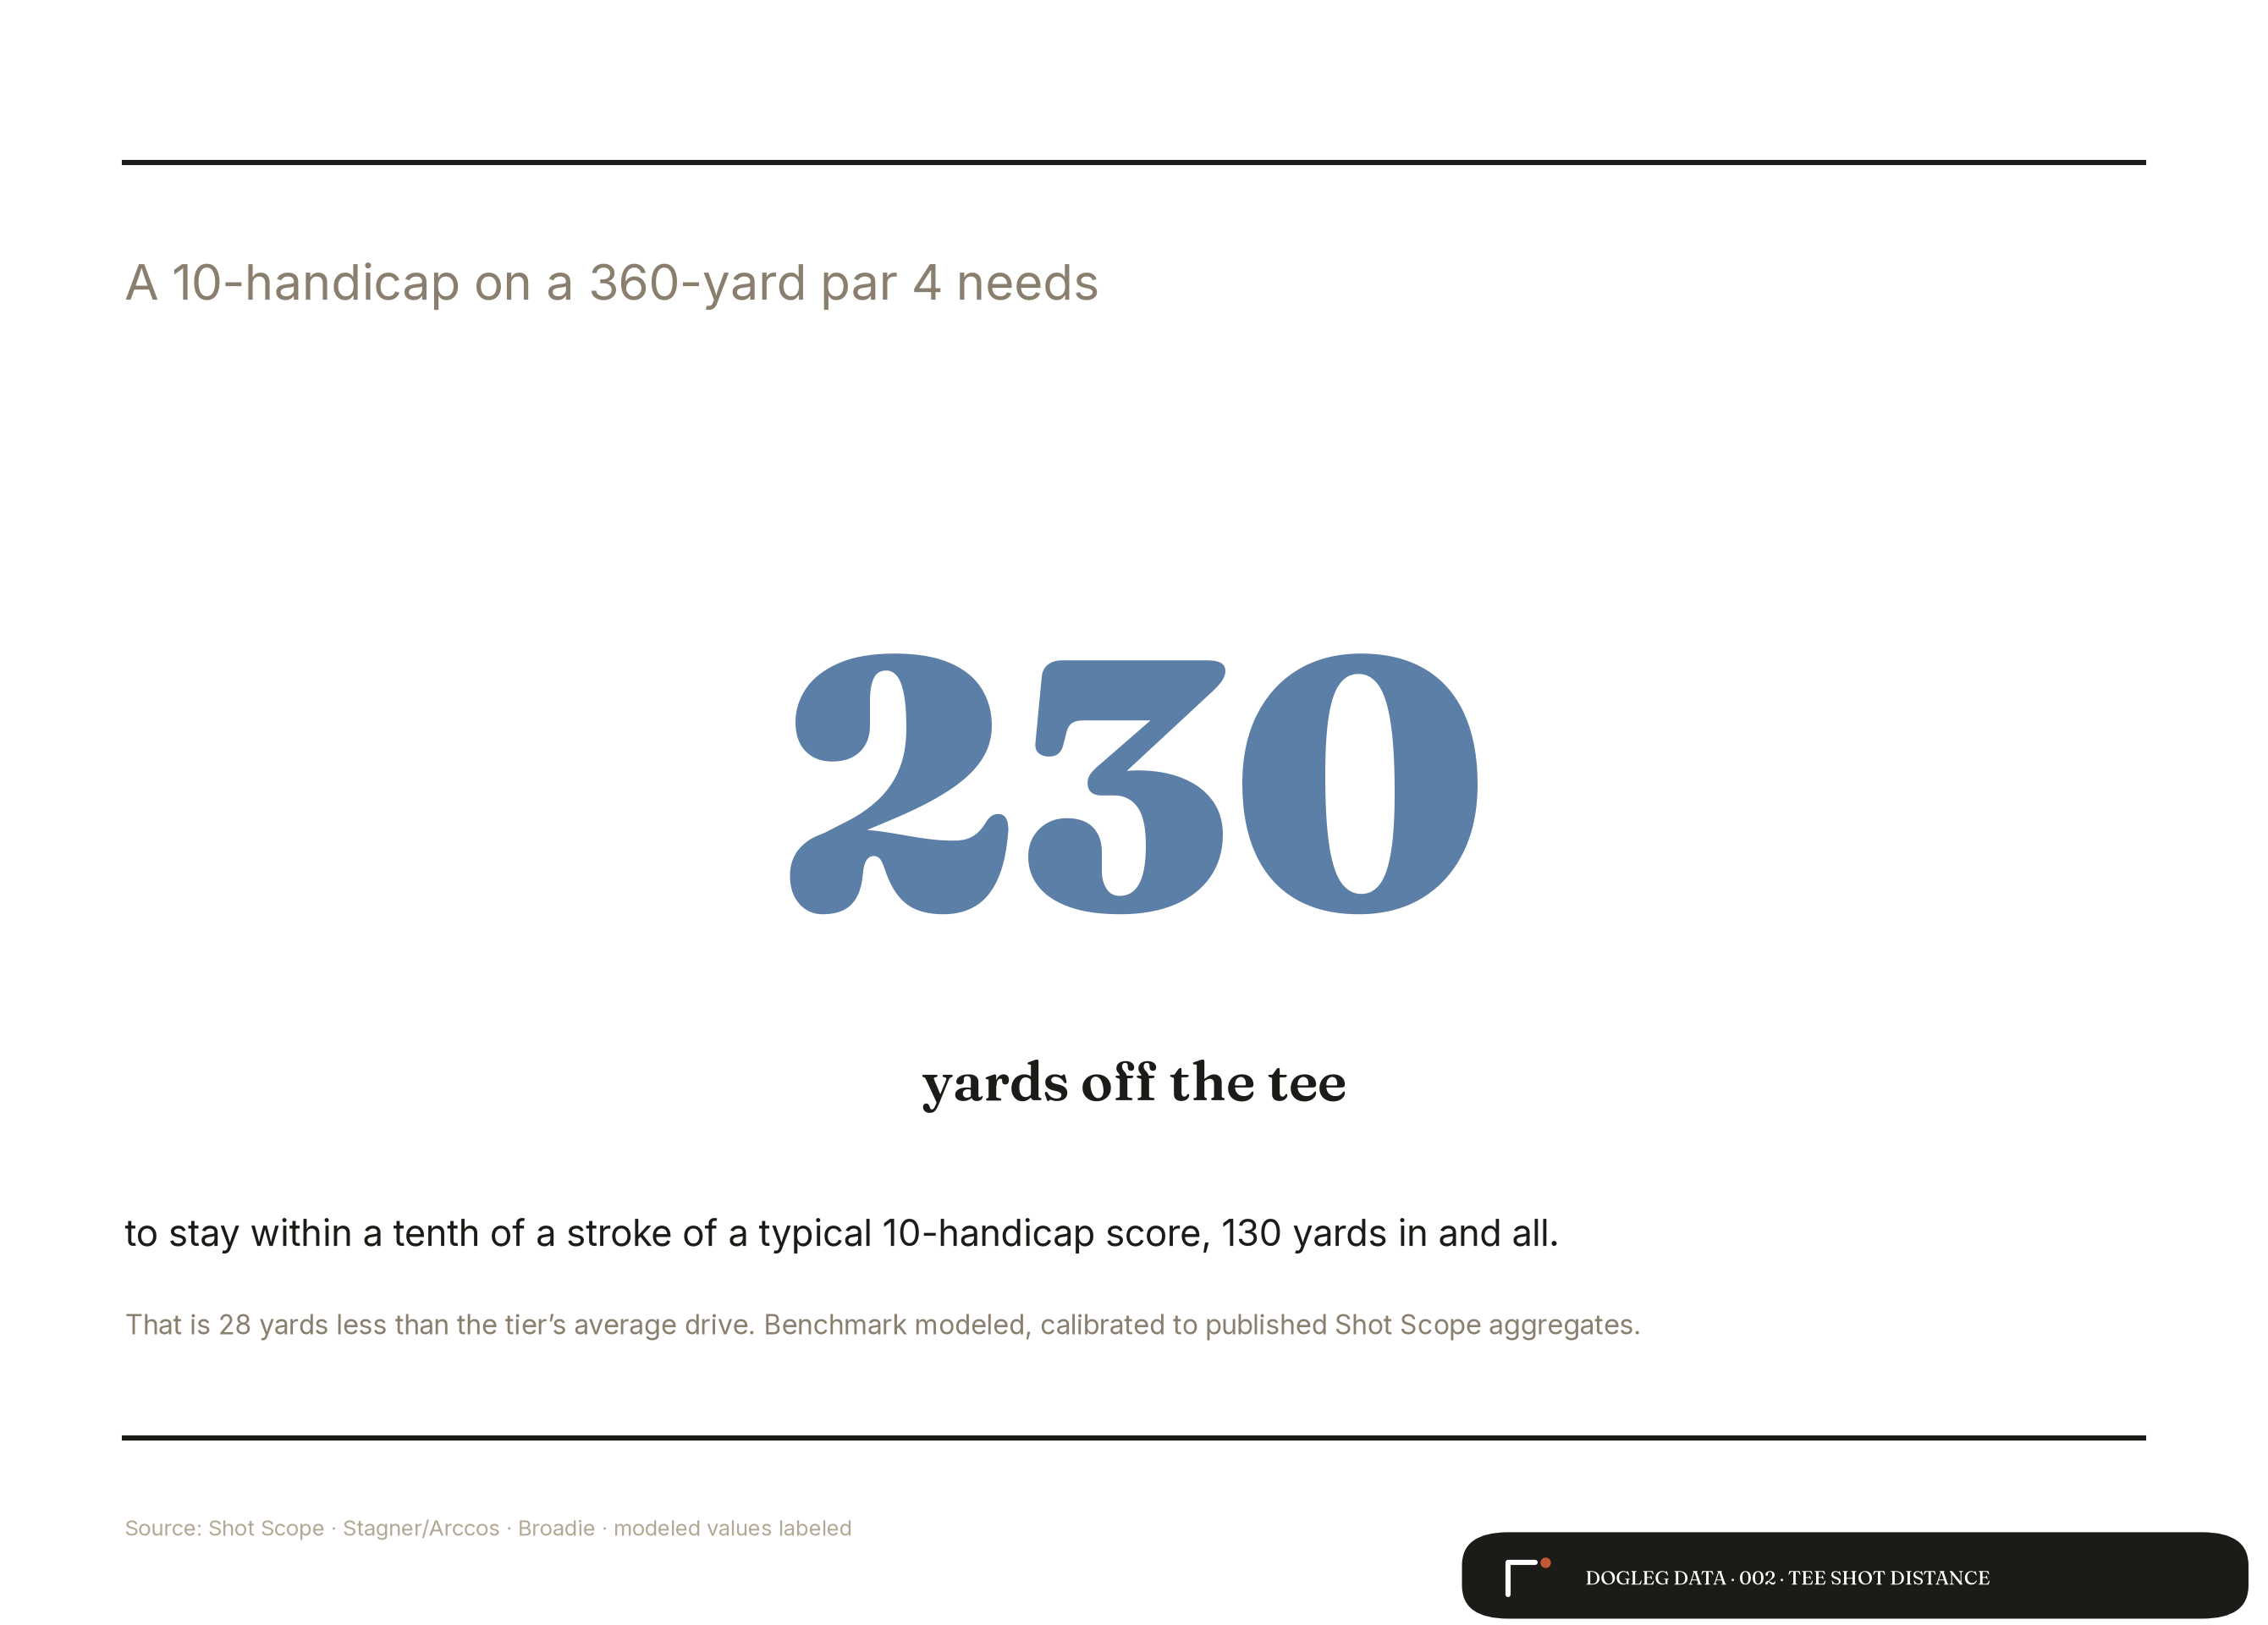
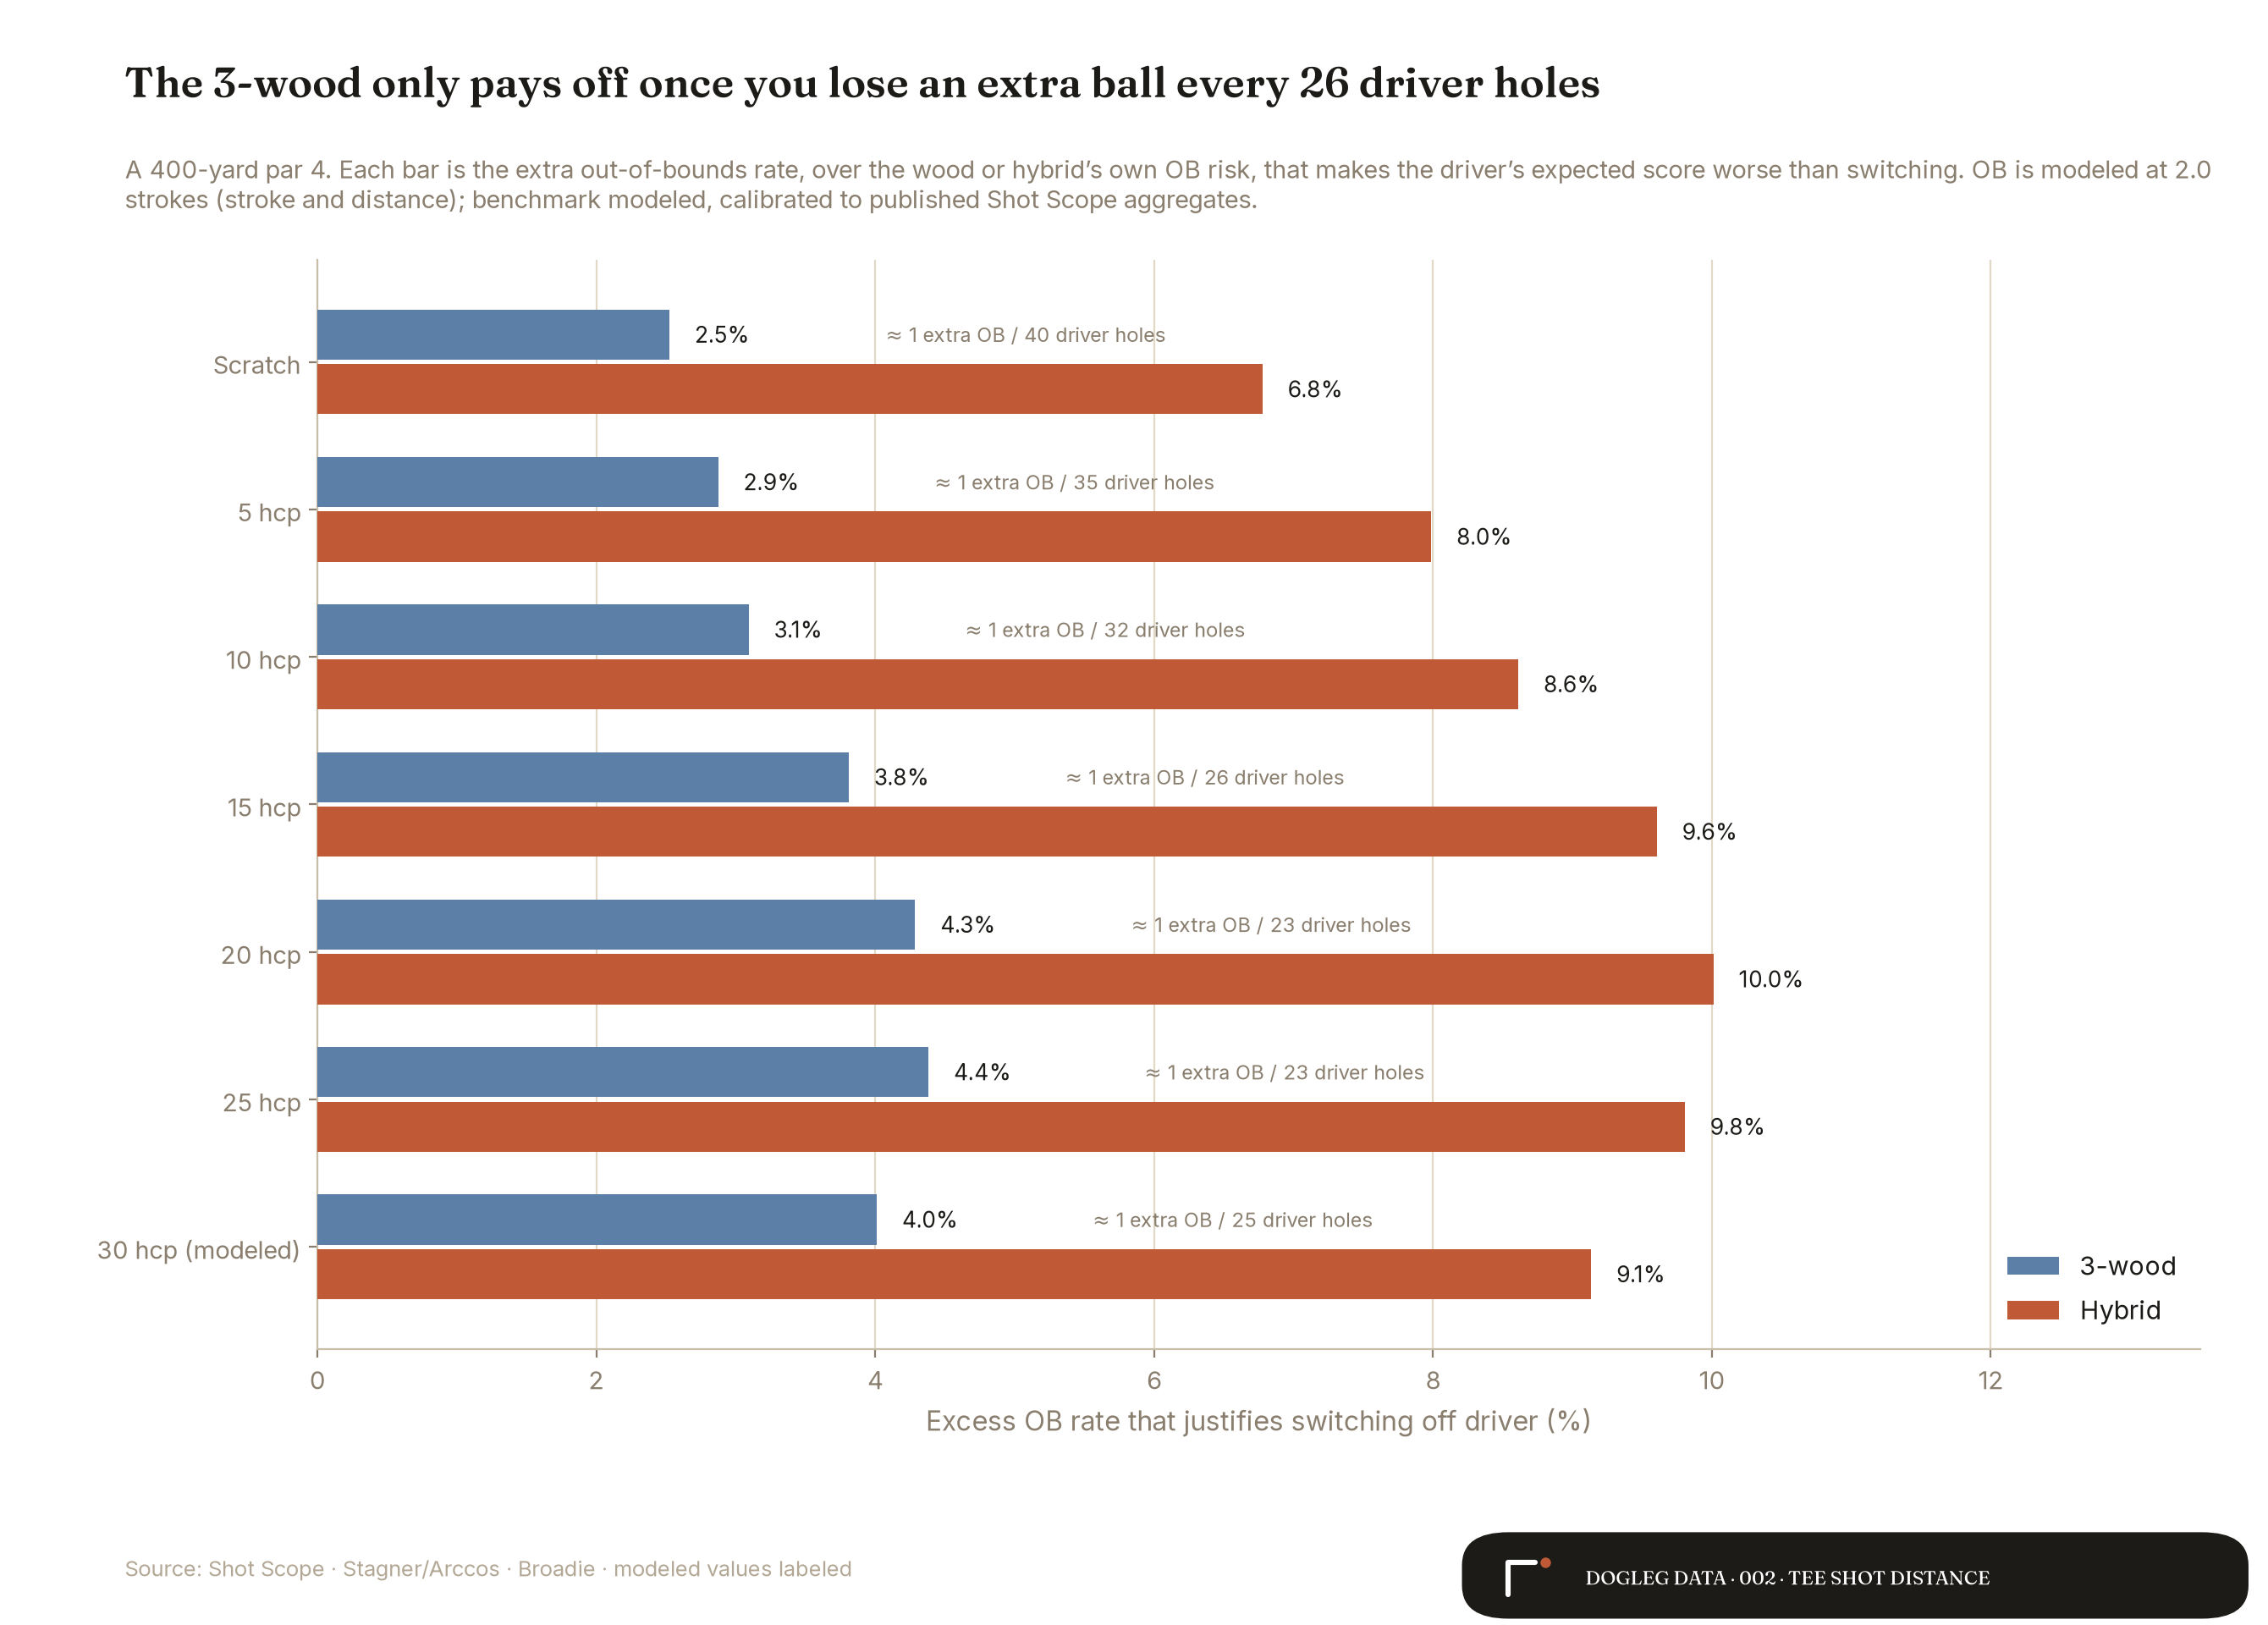
The citable stat: a 10-handicap on a 360-yard par 4 needs 230 yards off the tee to stay within a tenth of a stroke of a typical 10-handicap score, 28 yards under the tier's average drive. Benchmark modeled, calibrated to published Shot Scope aggregates; the label is on every image.
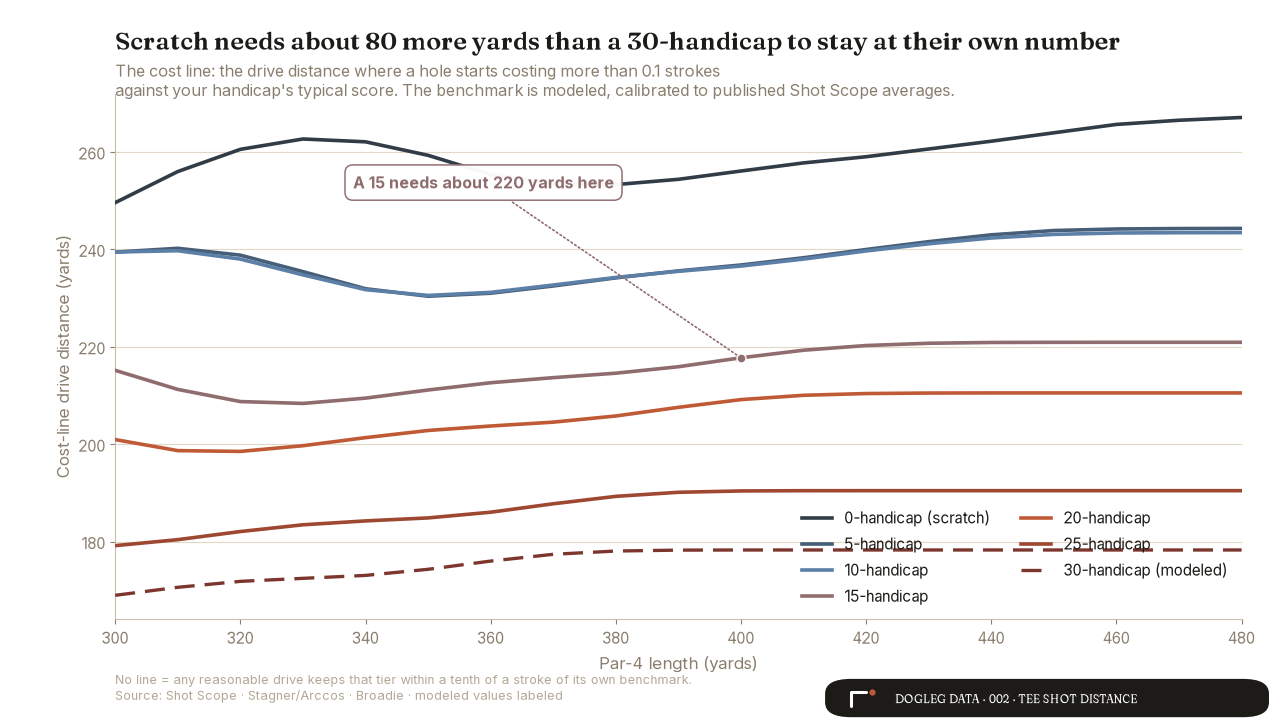
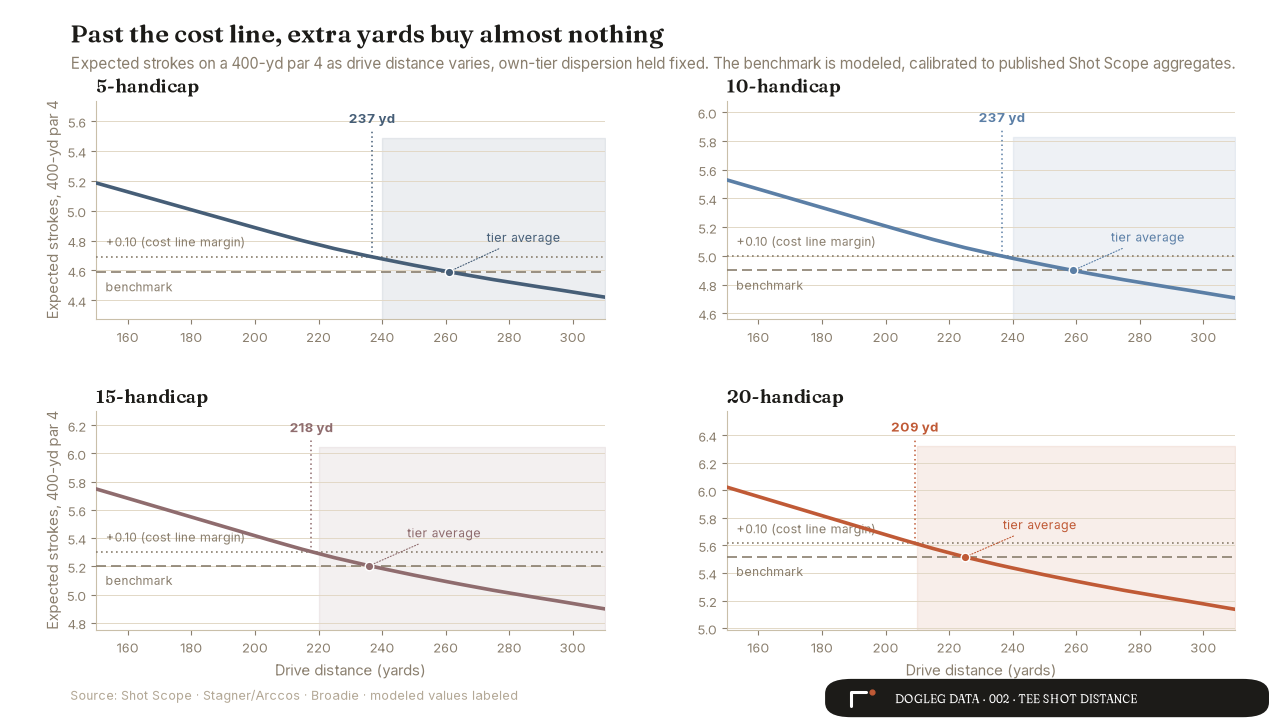
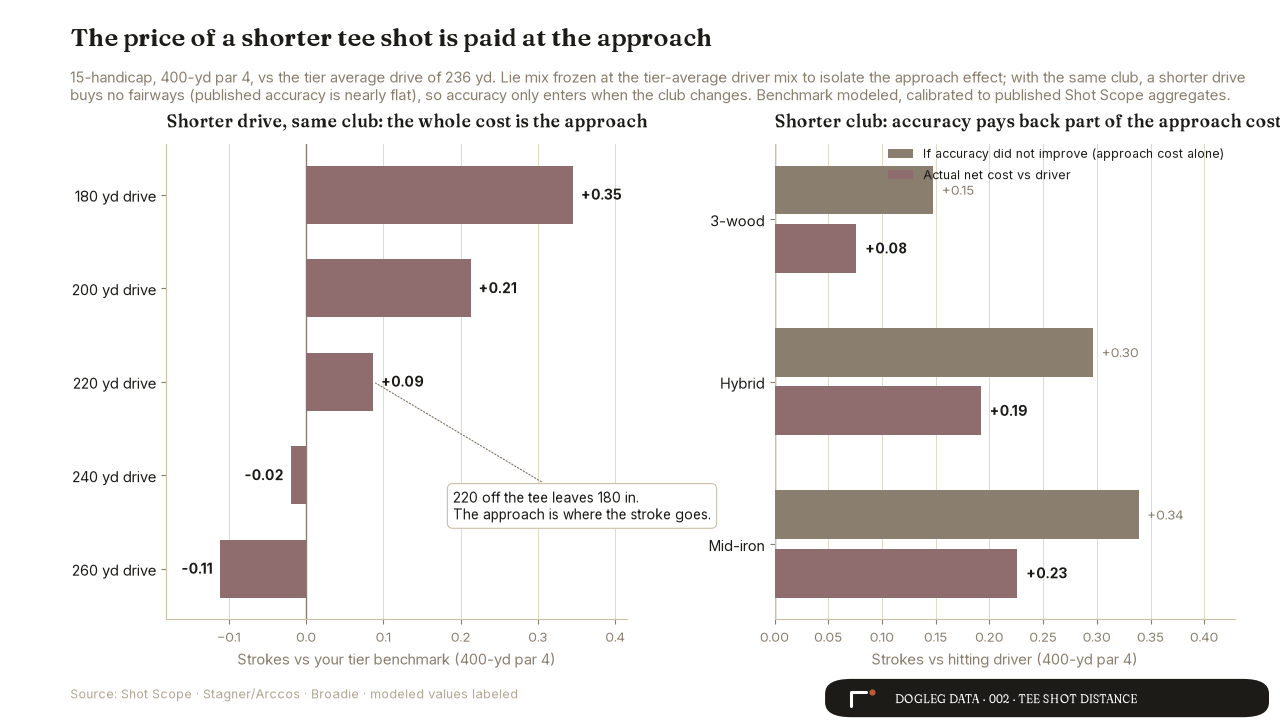
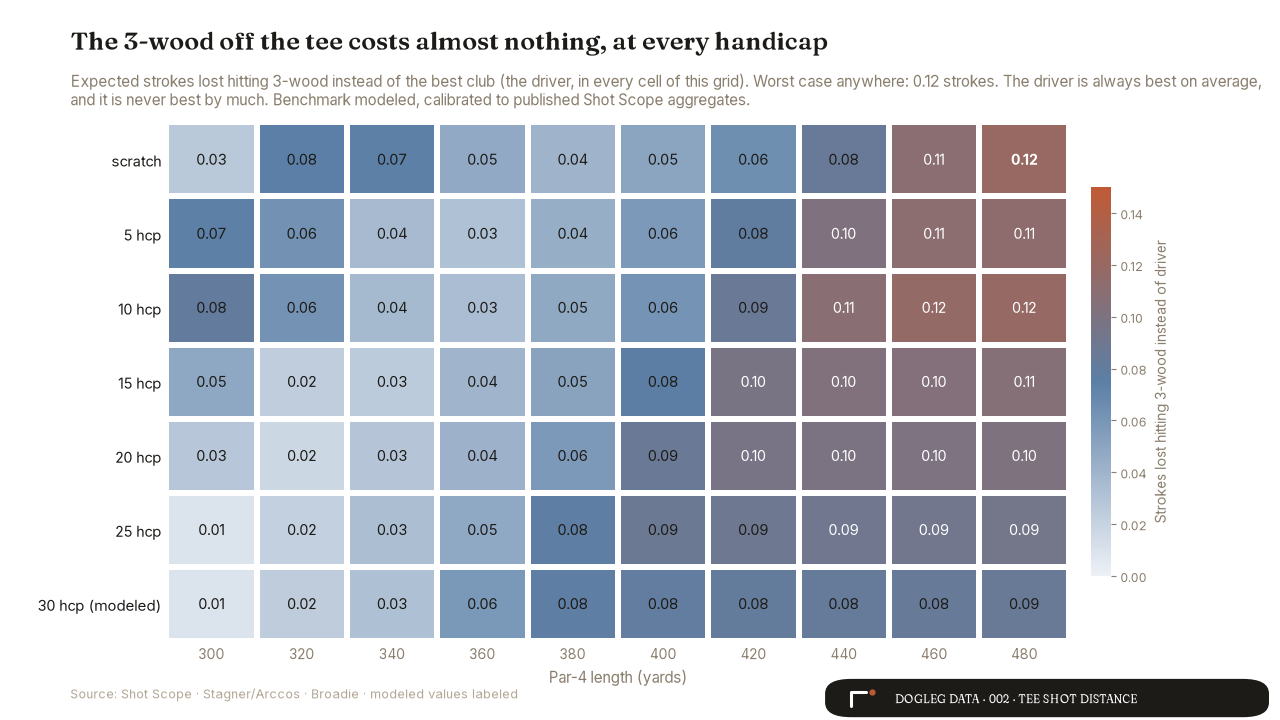
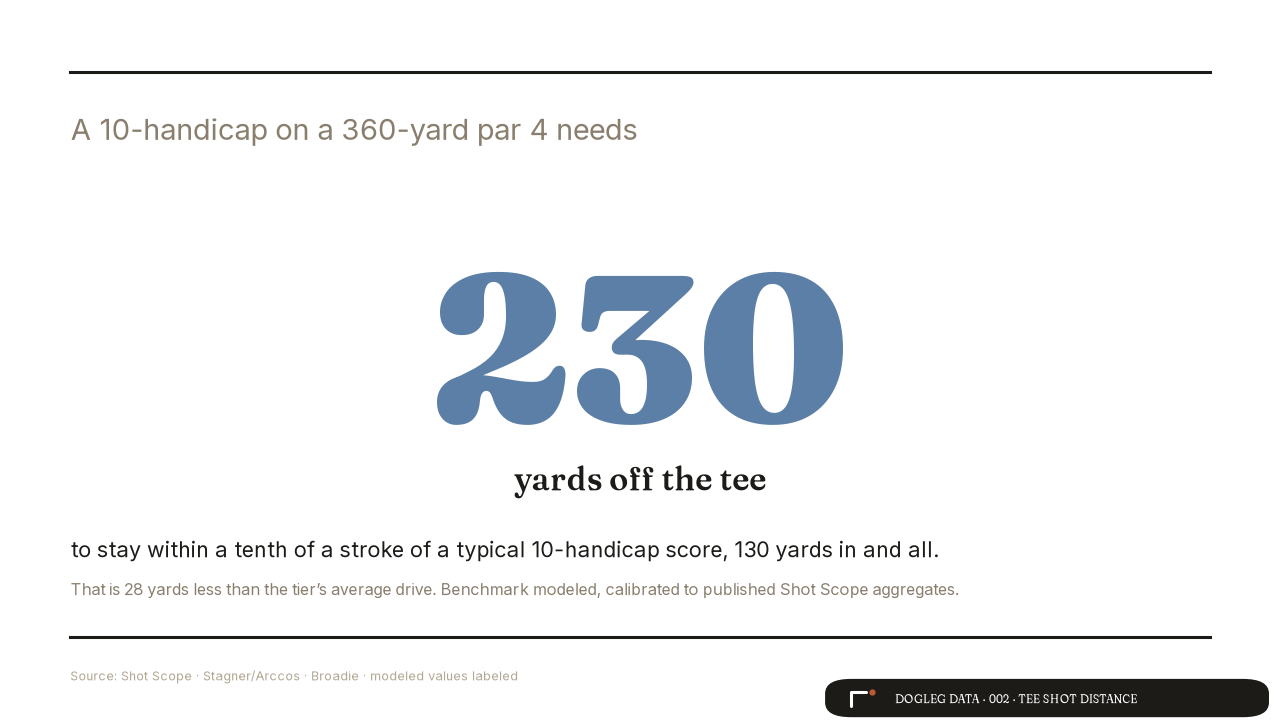
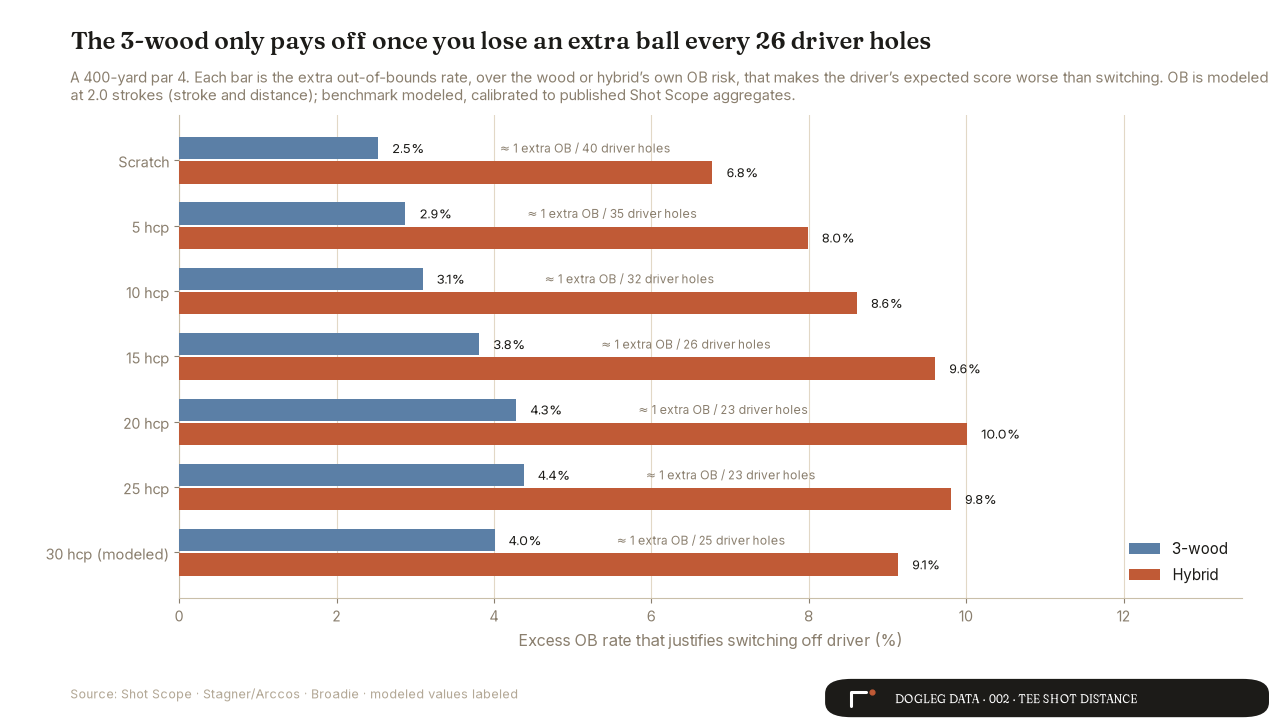
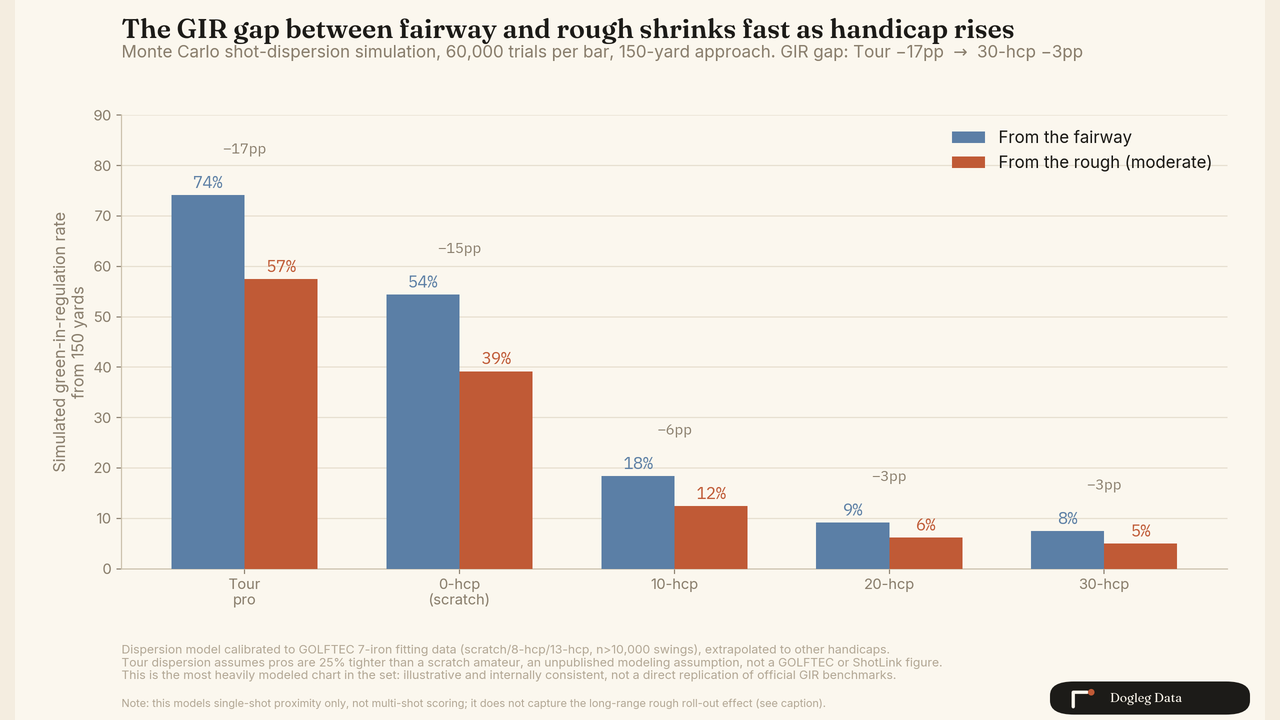
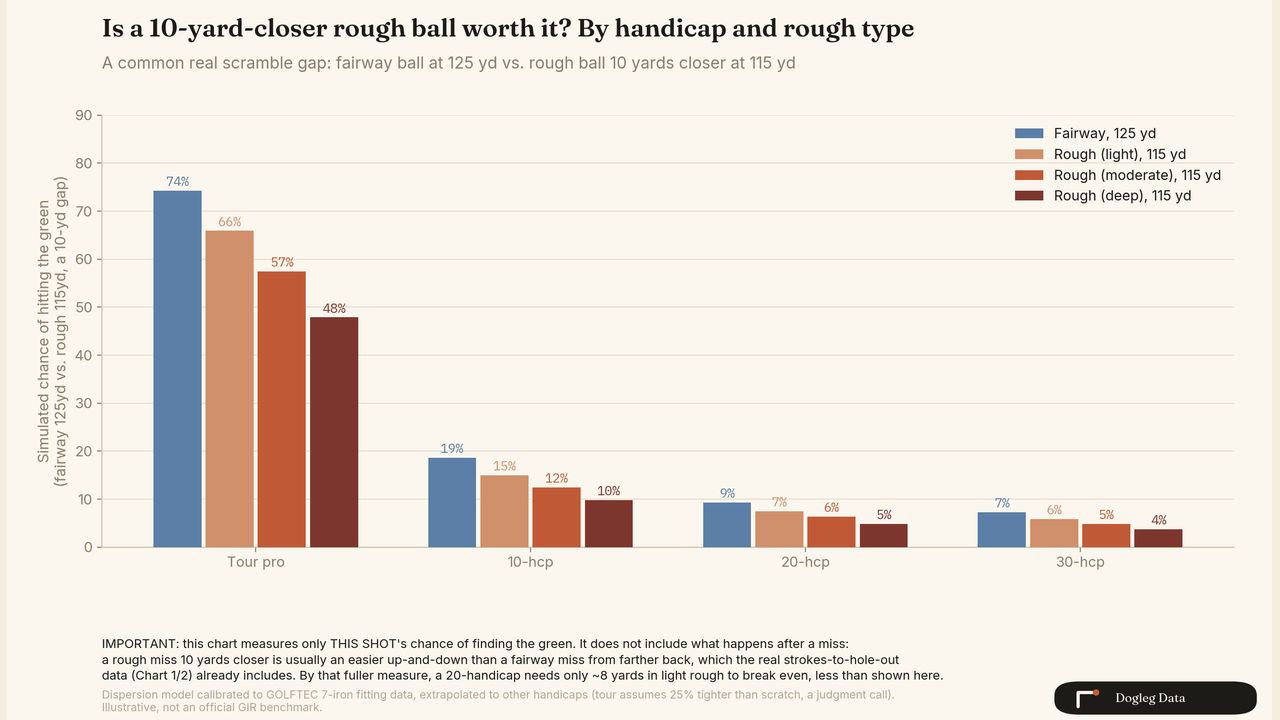
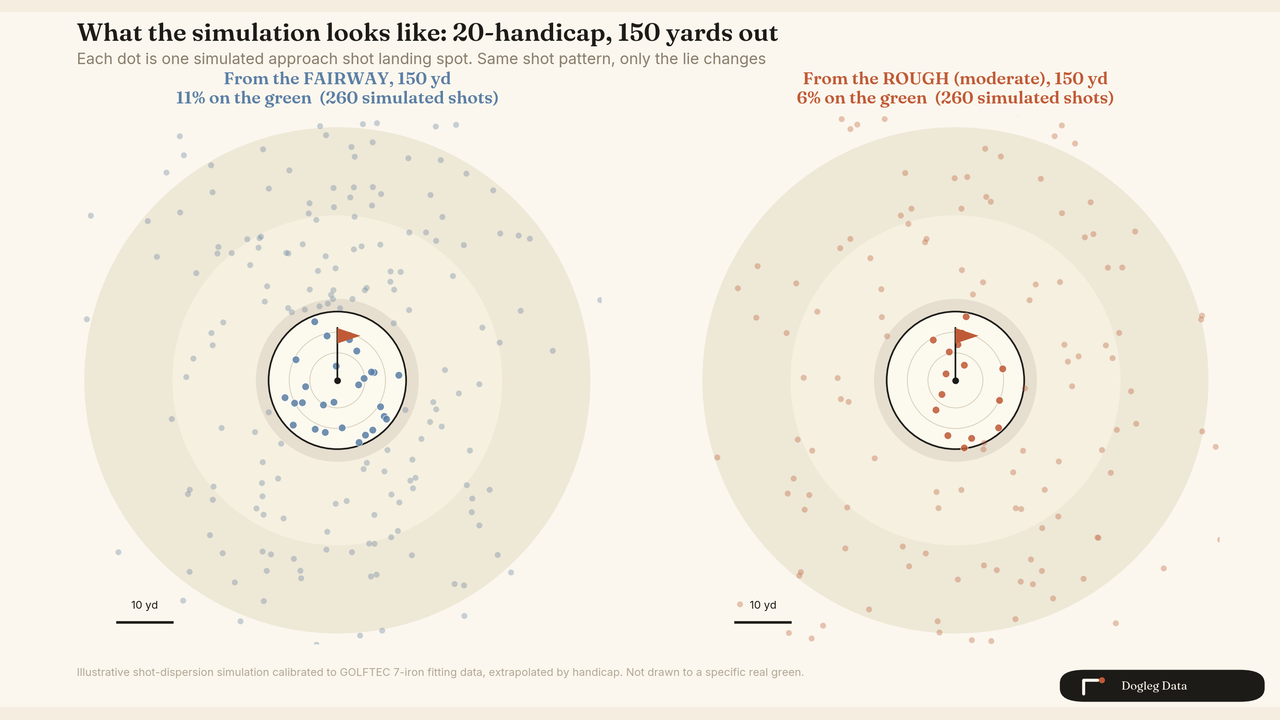
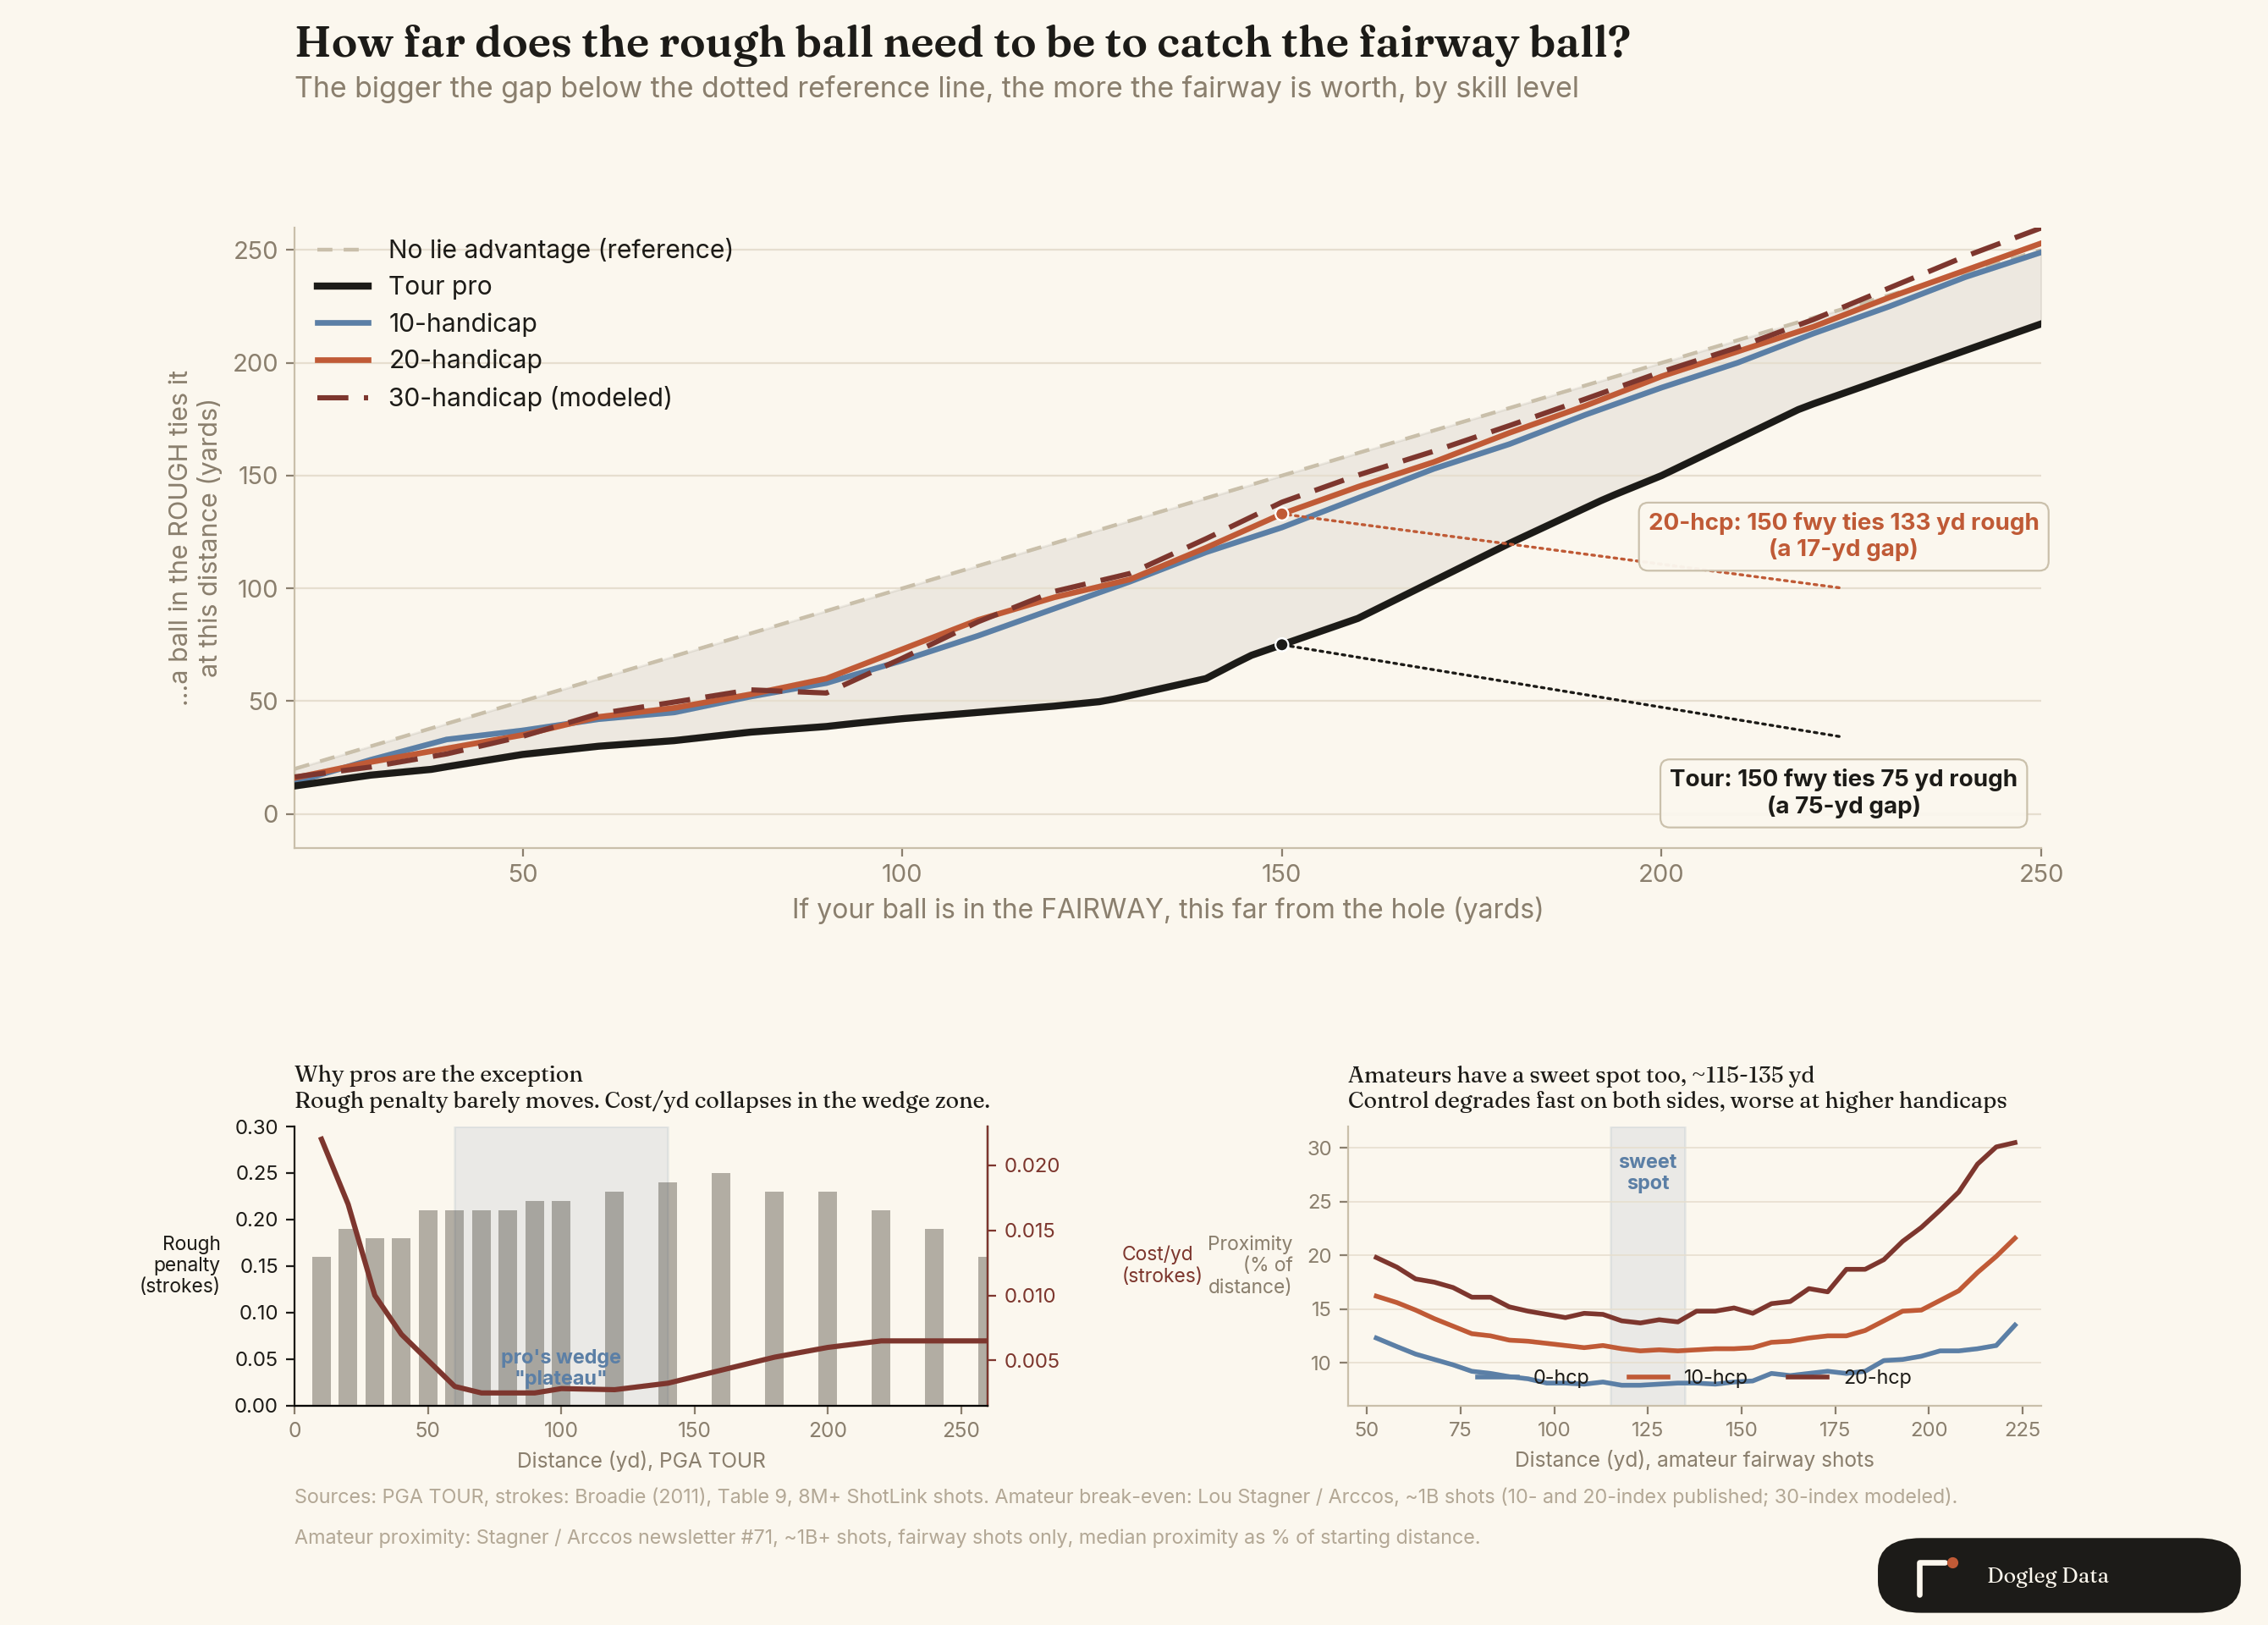
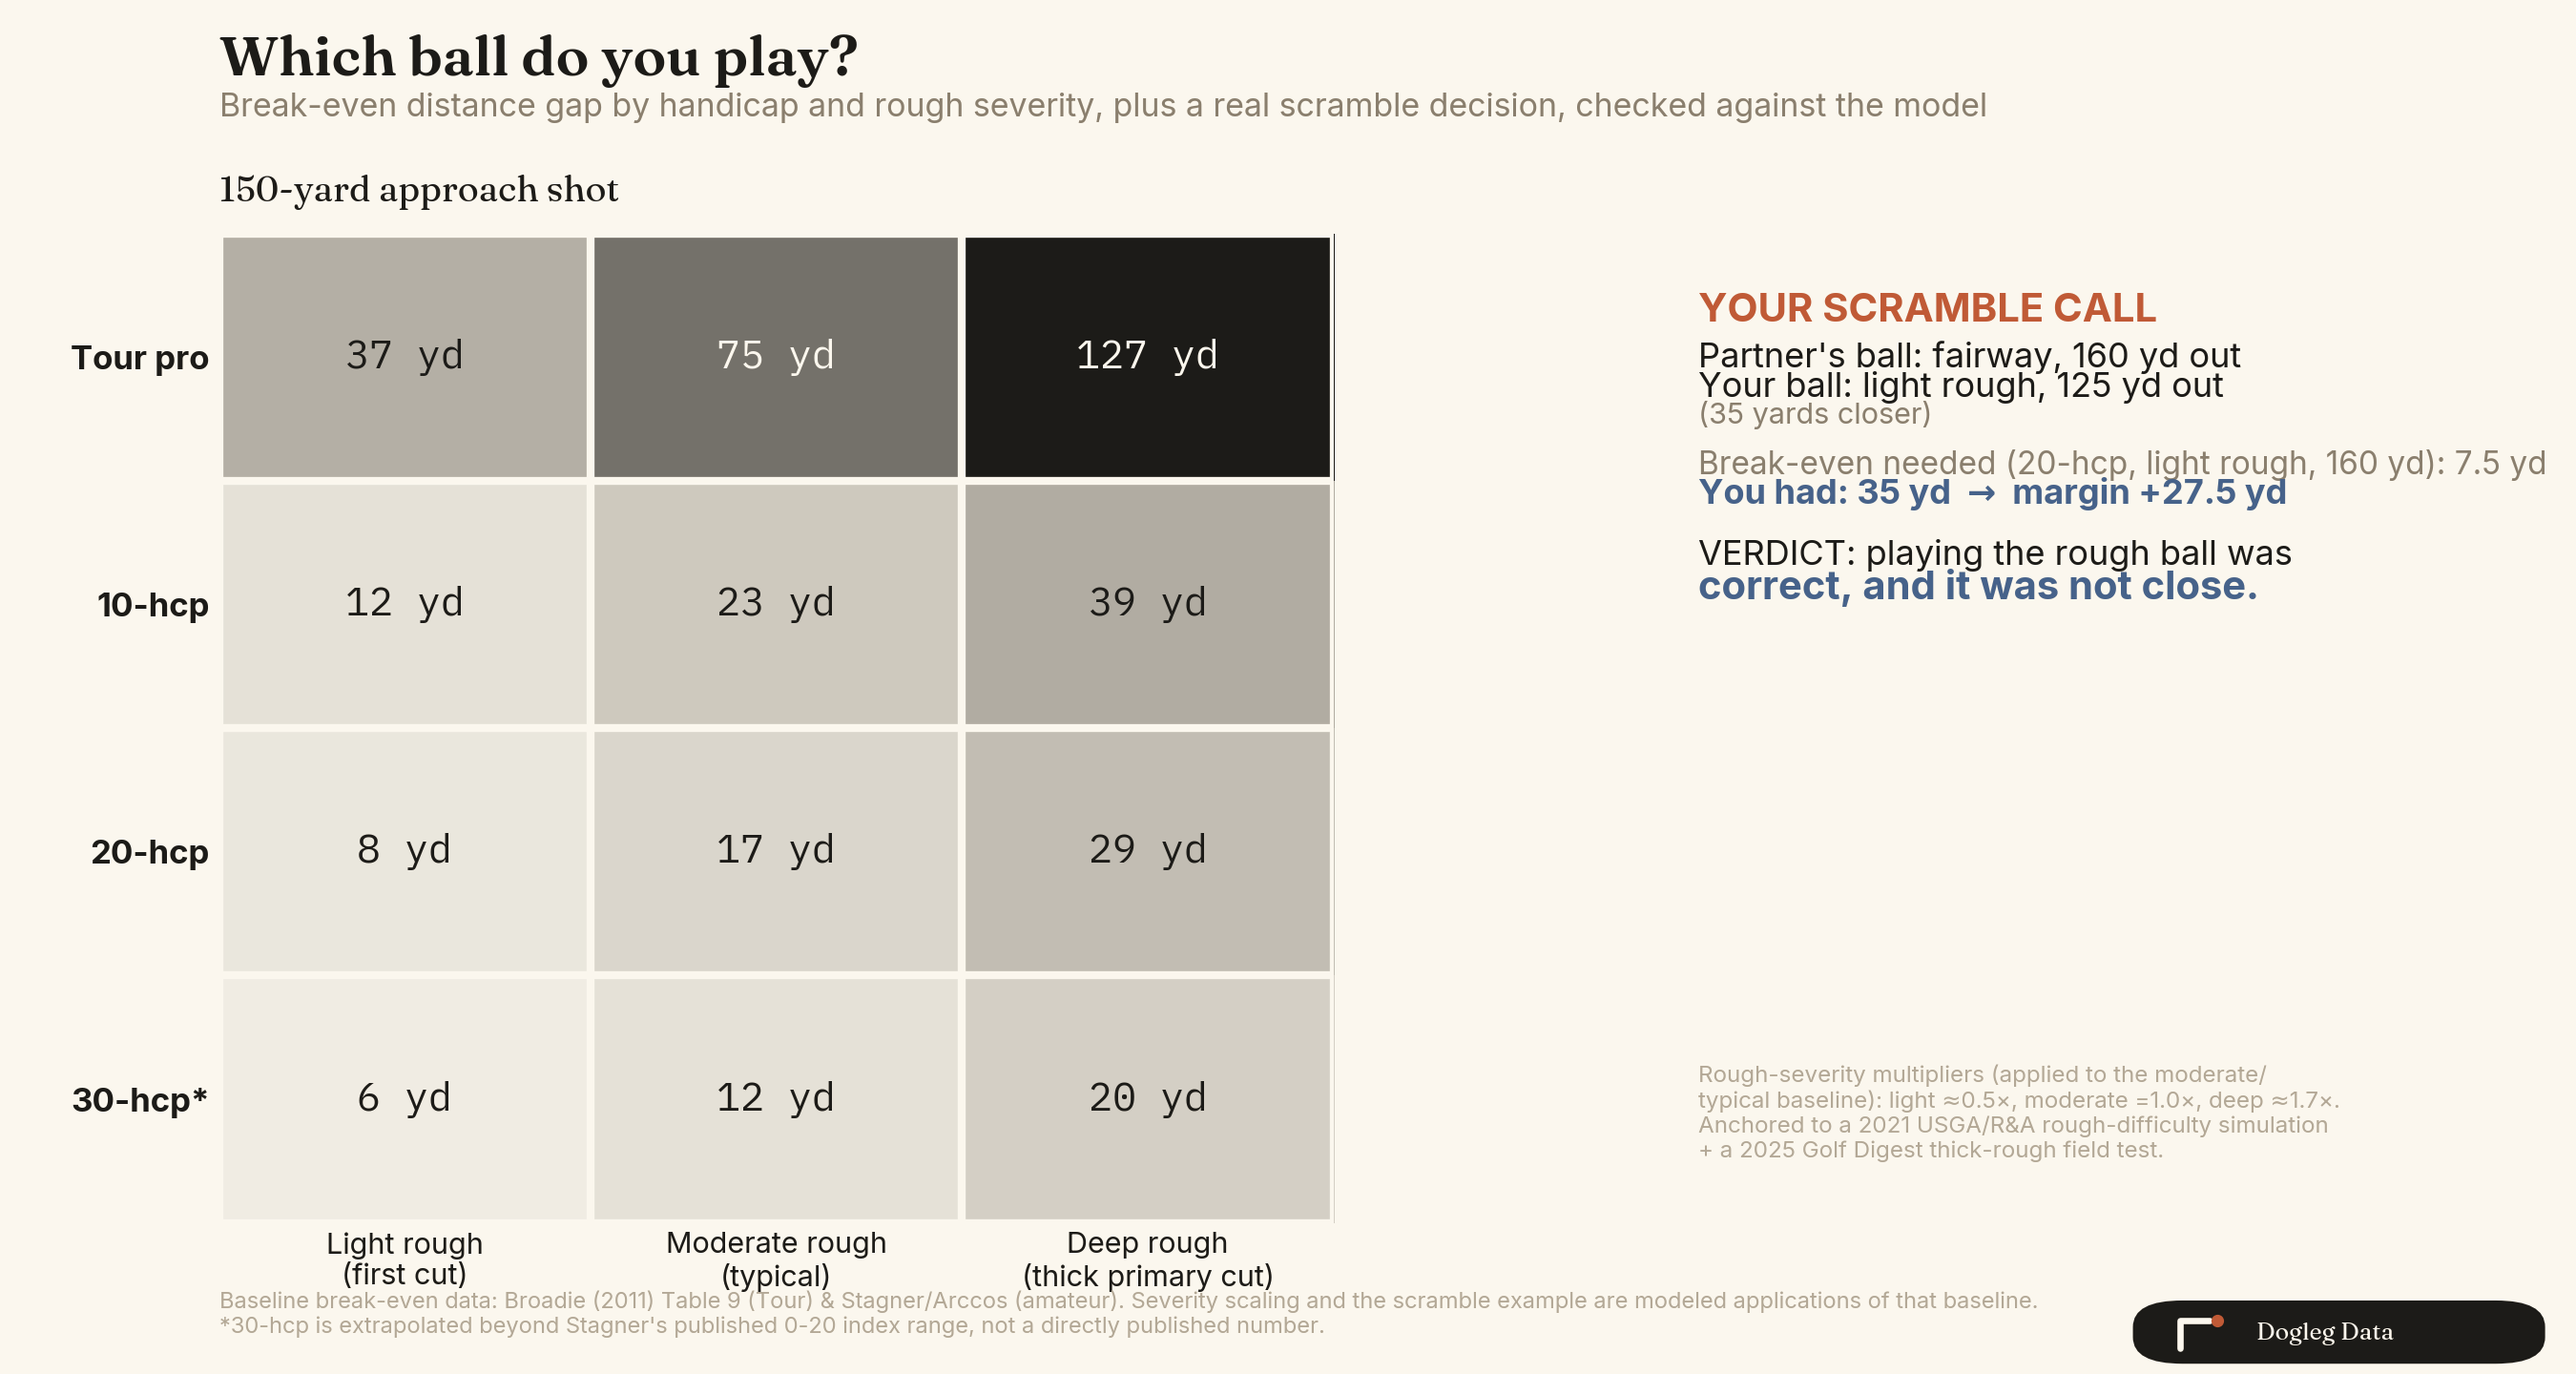
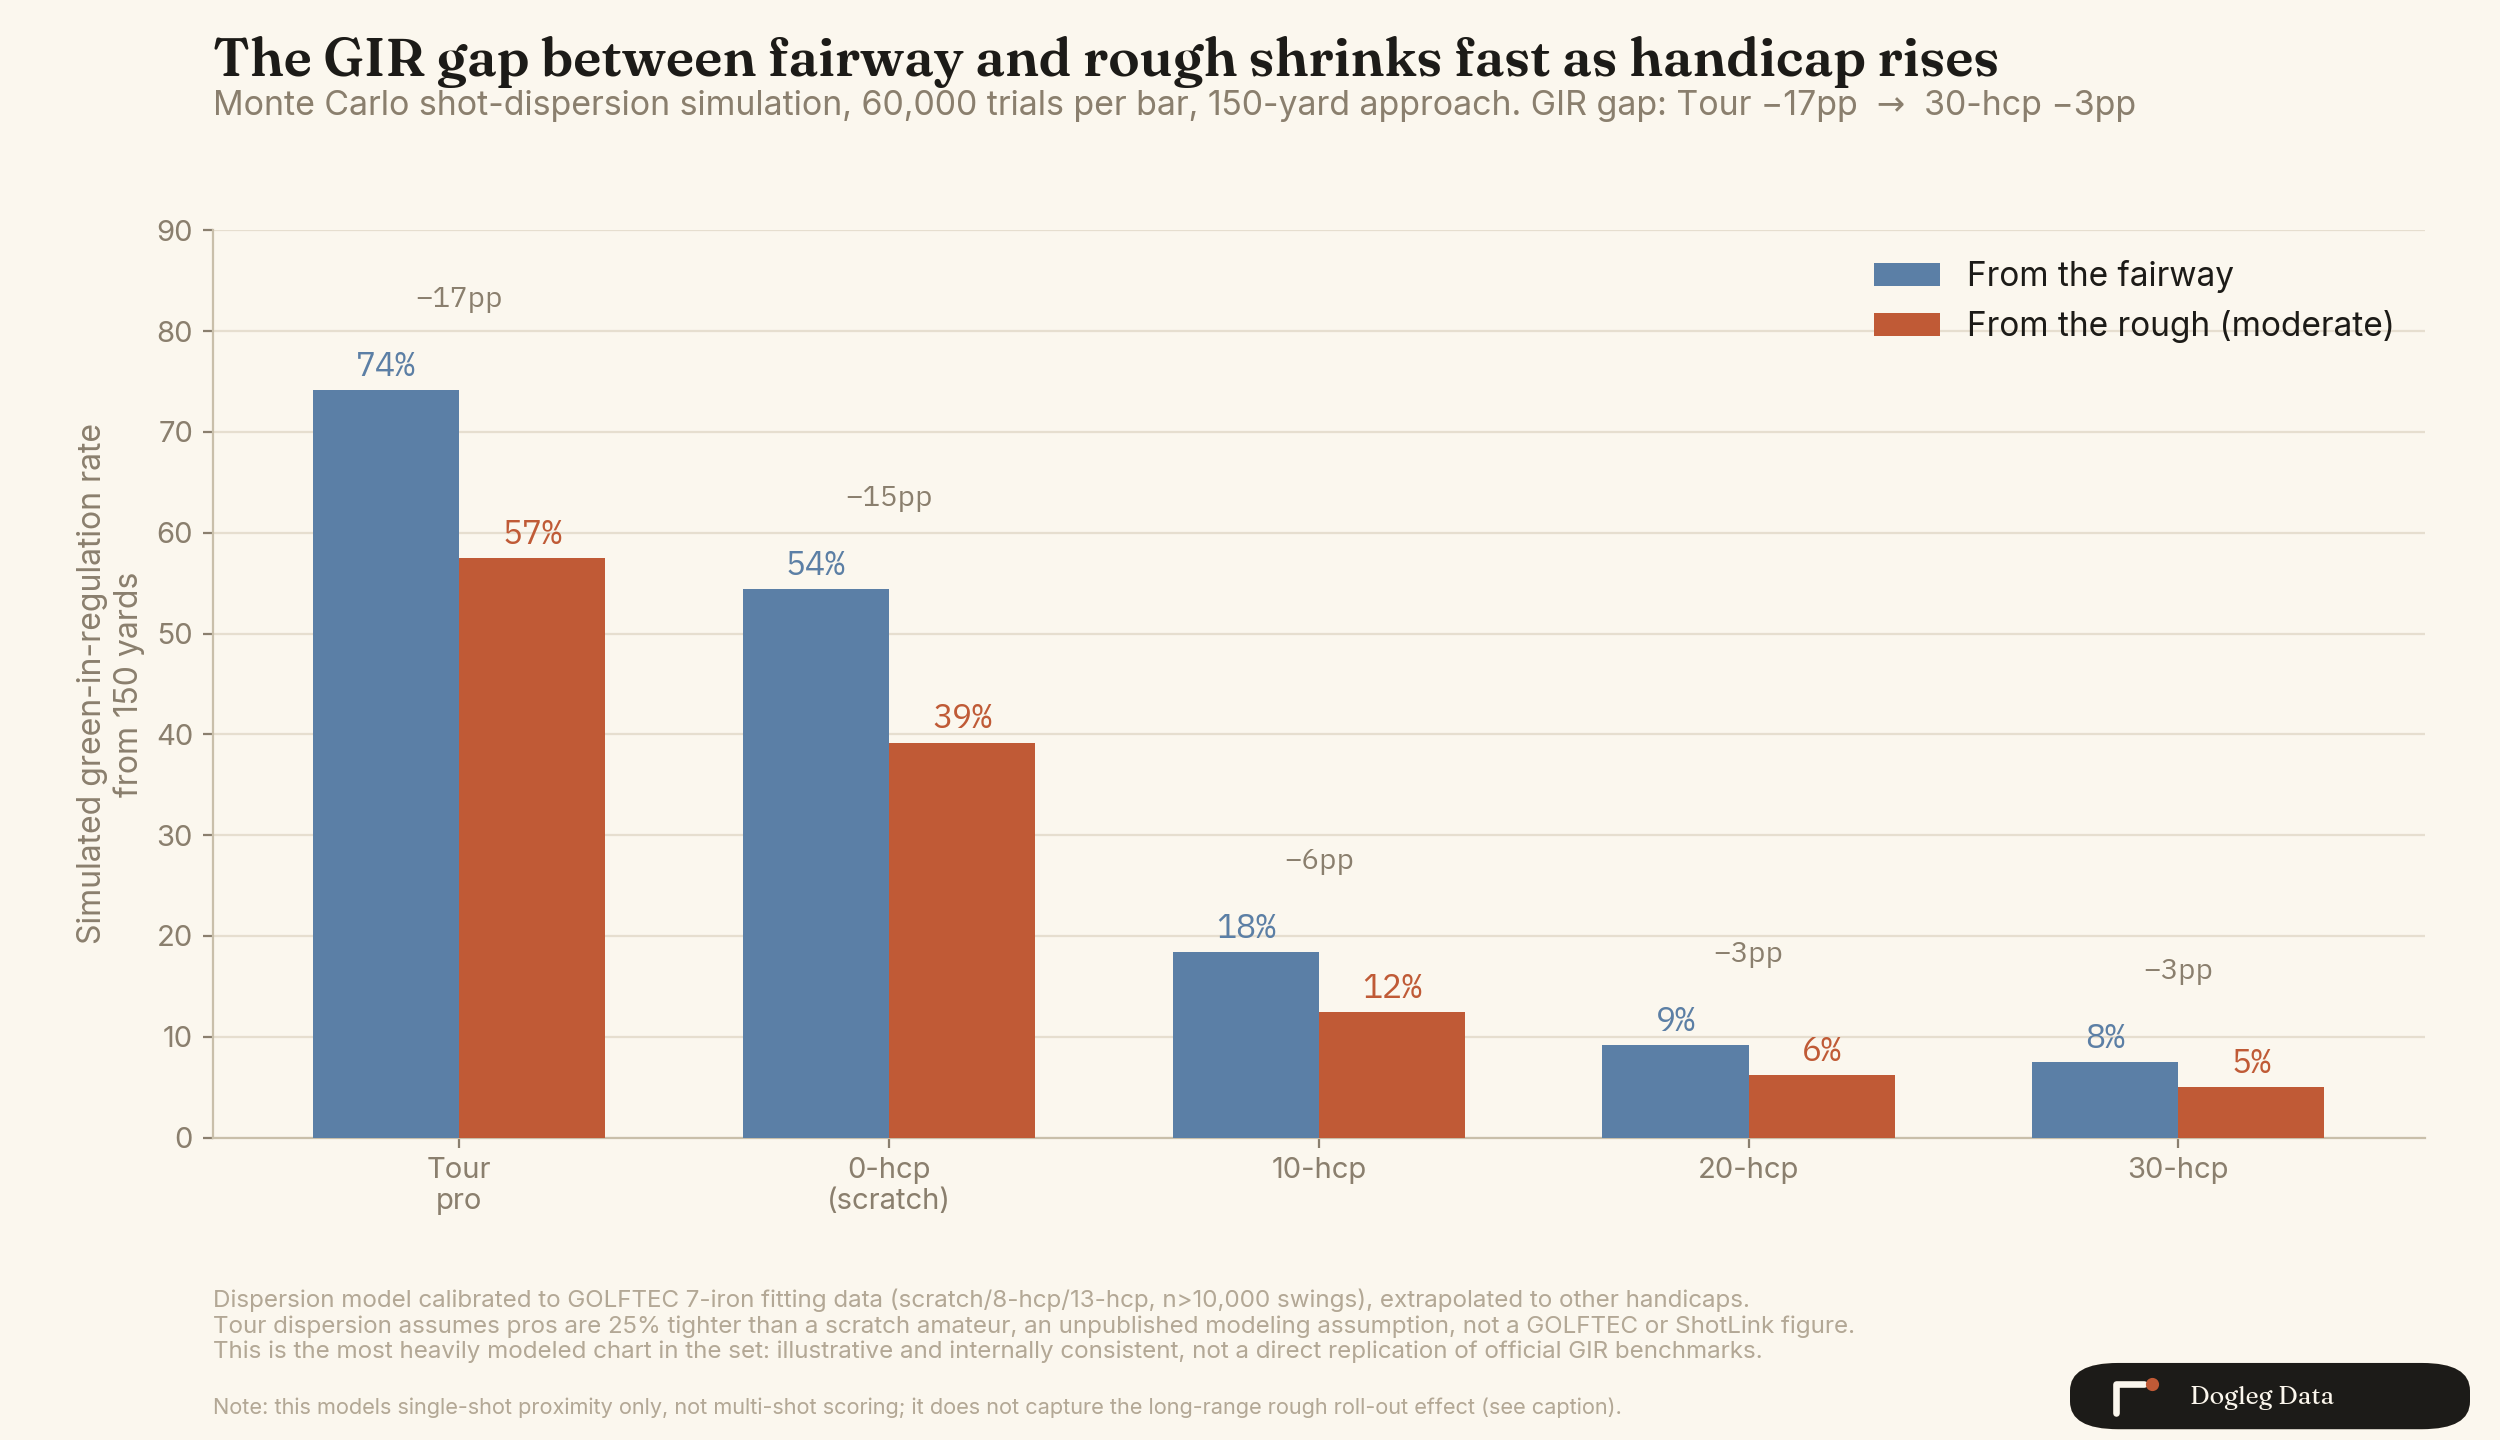
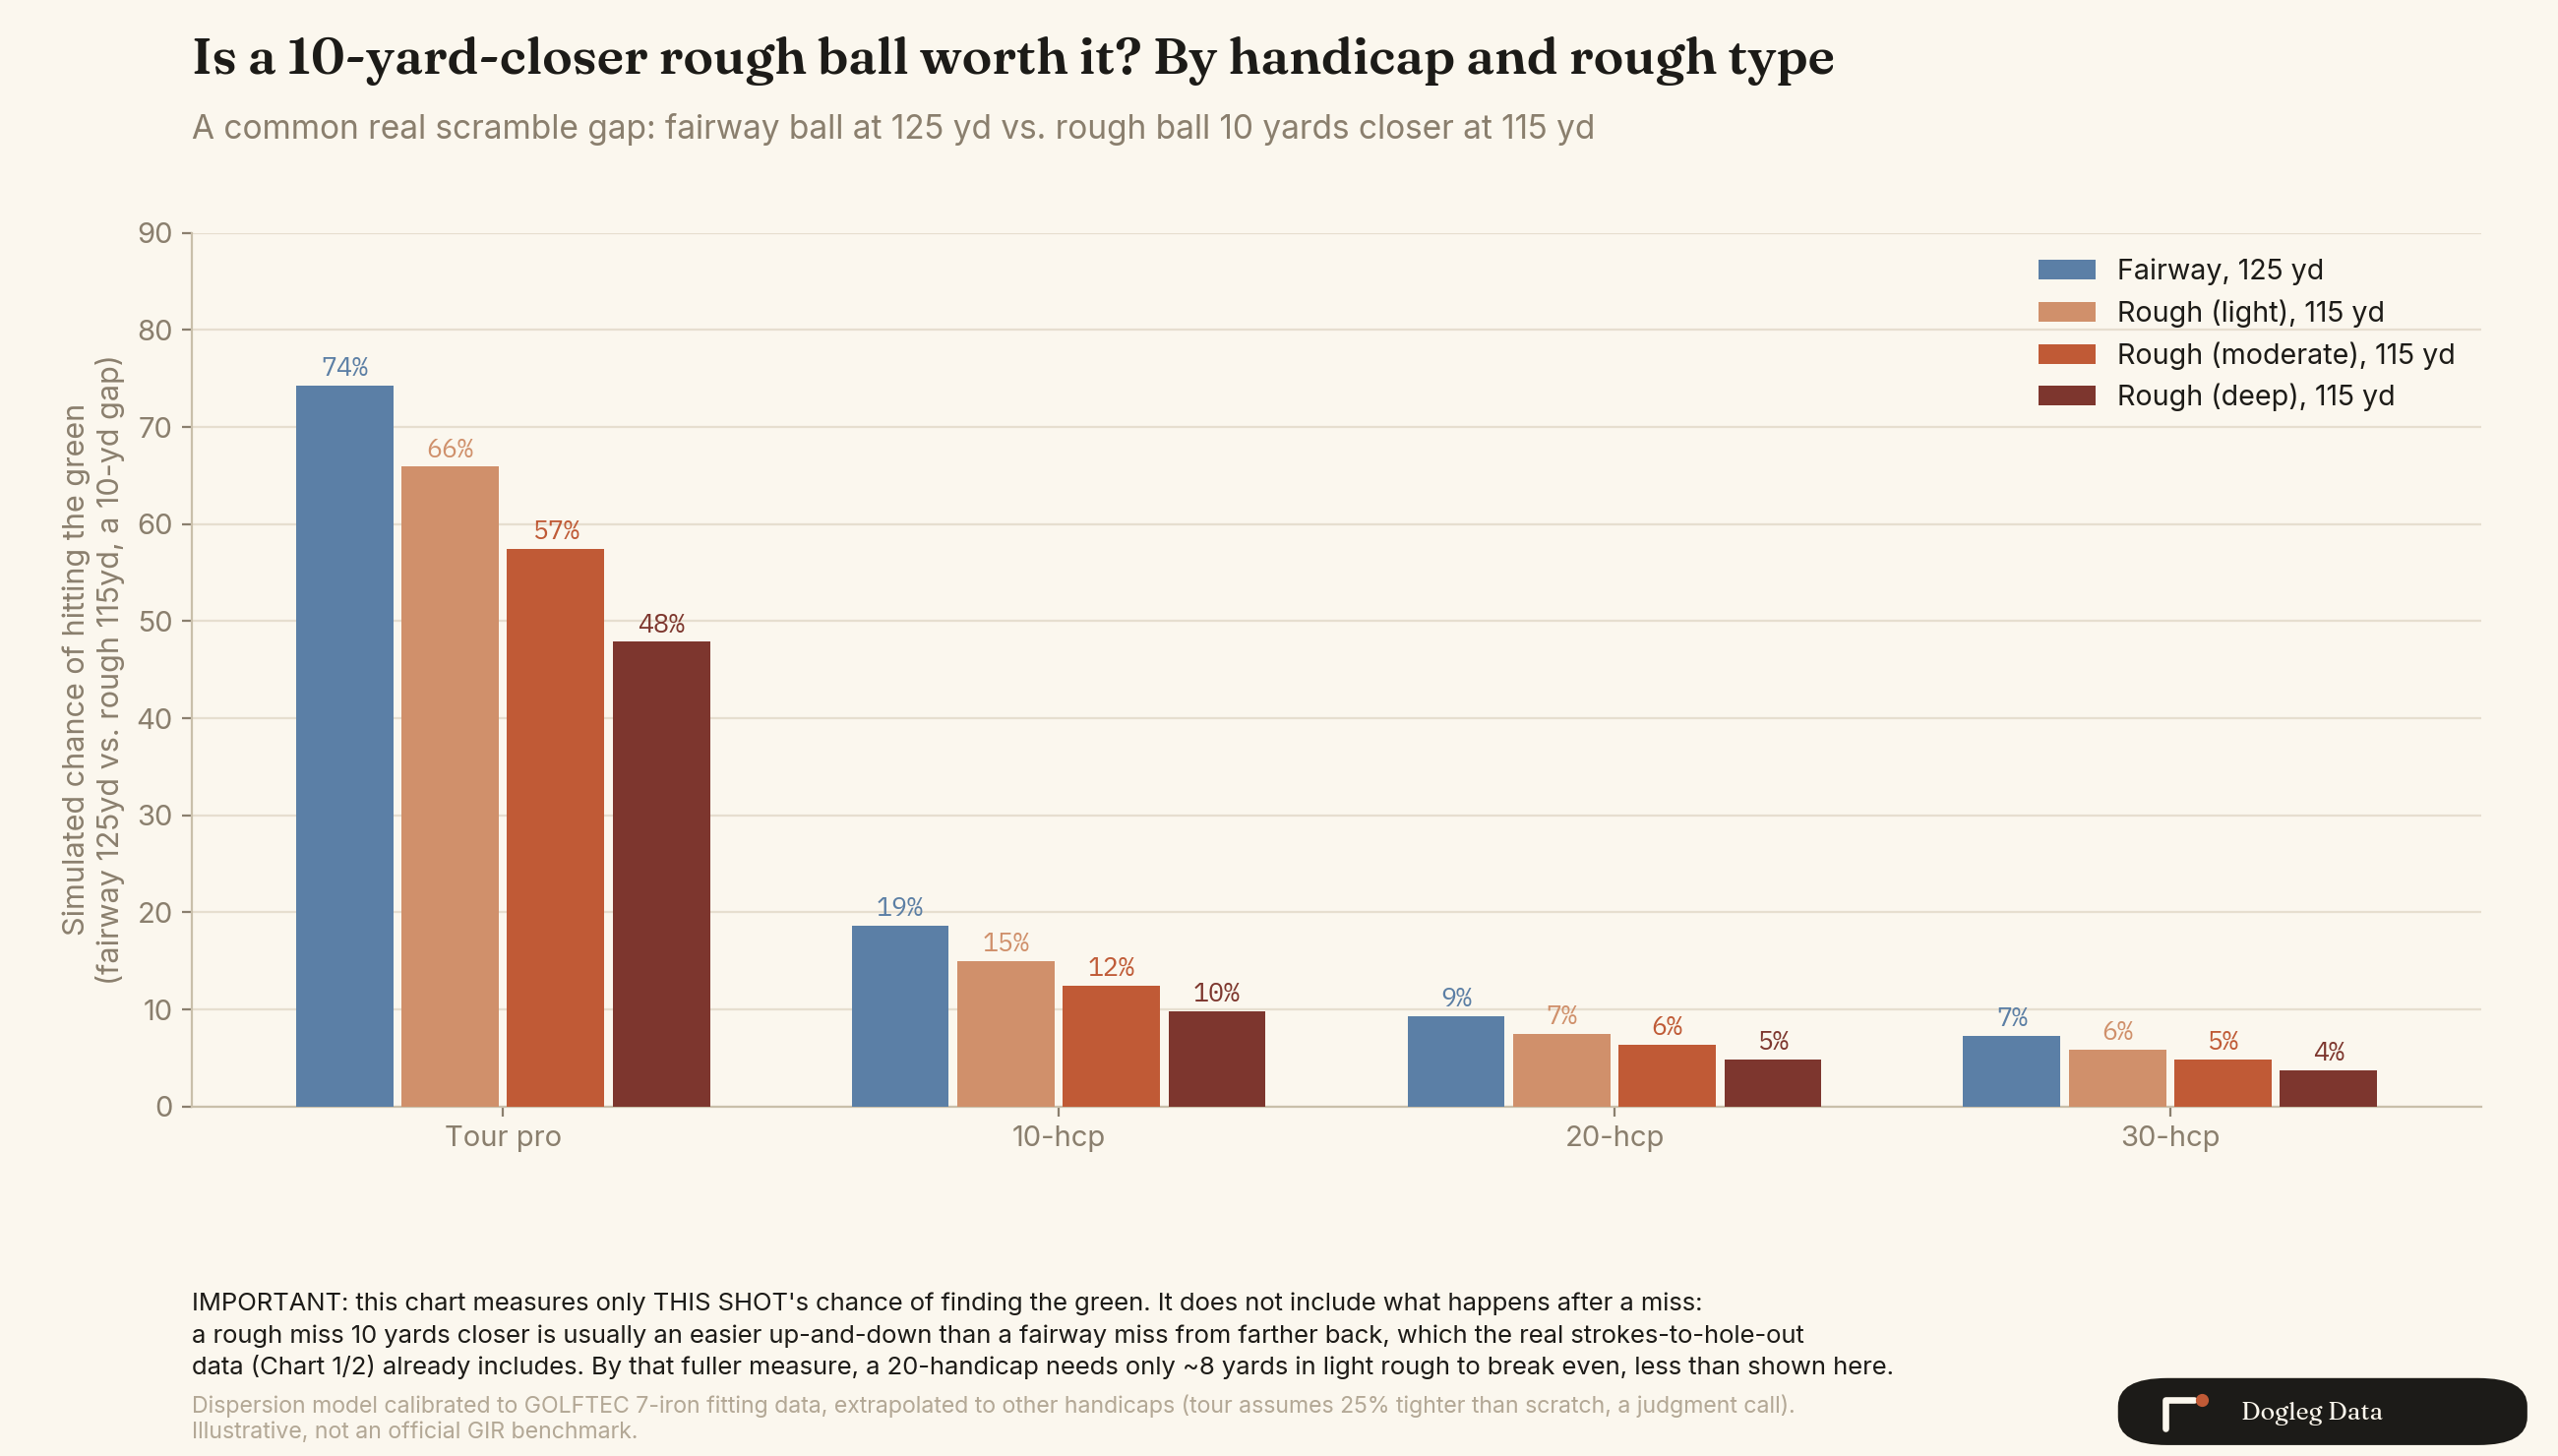
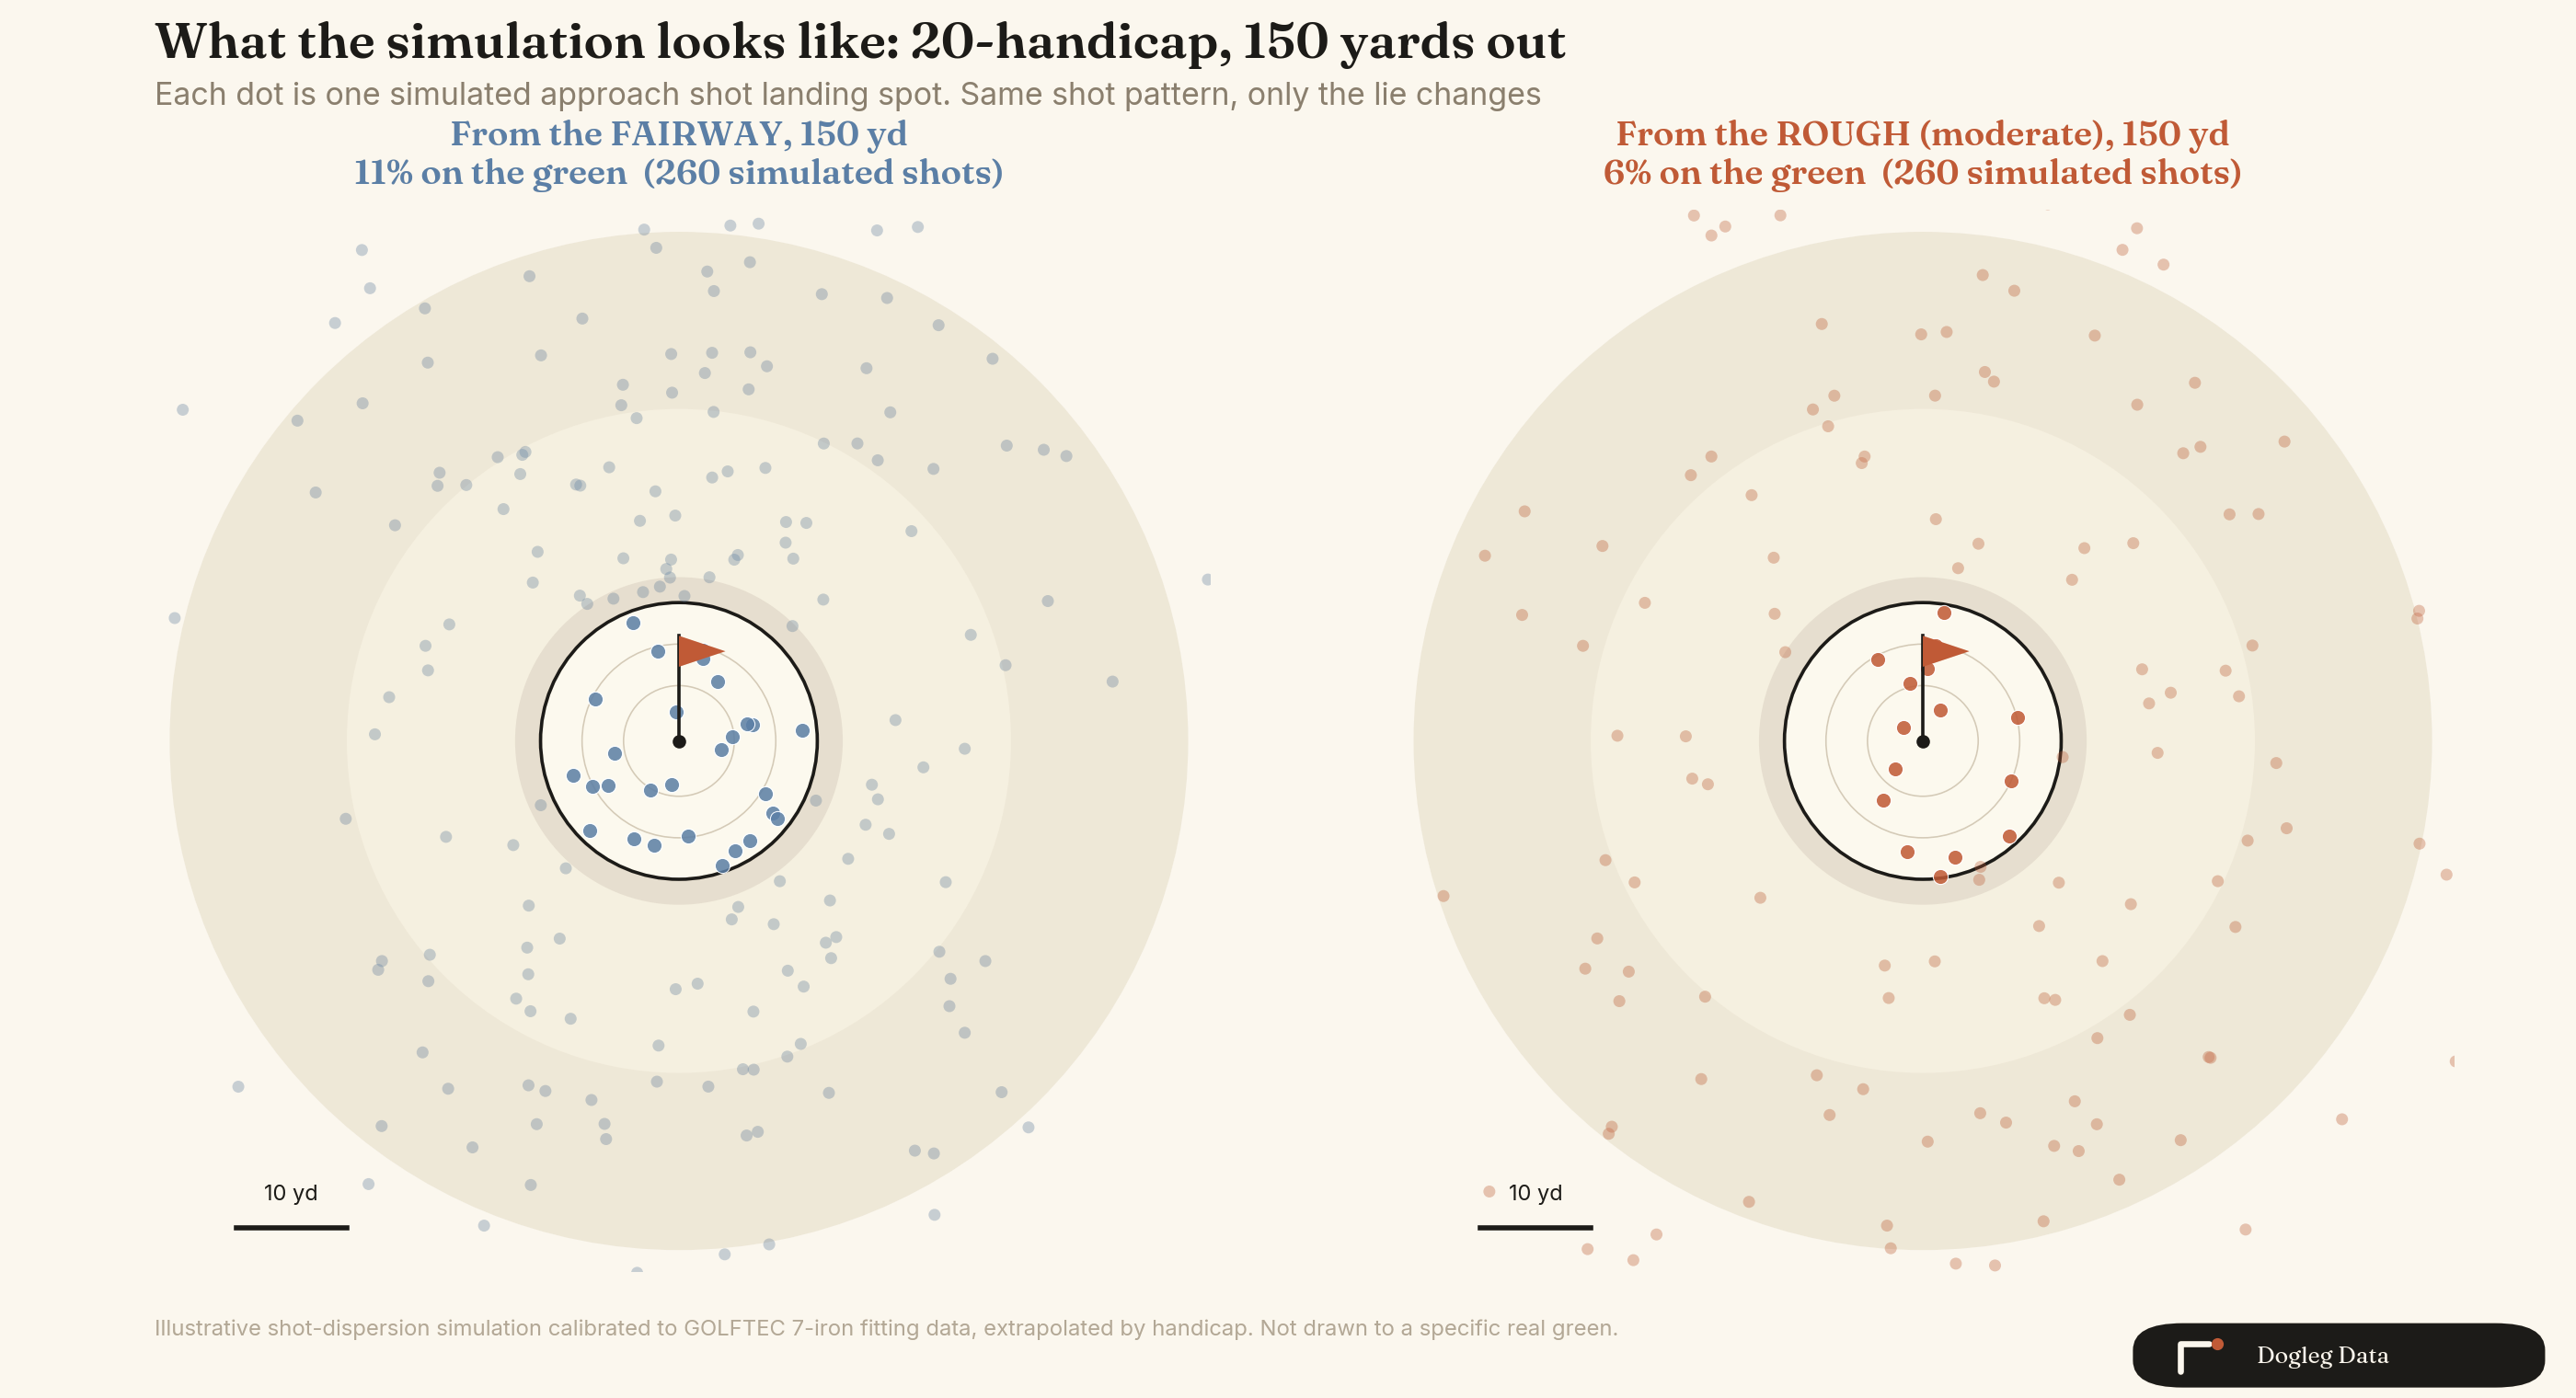
Chart pack · Fairway vs. Rough, by Handicap
Test your own numbers before you cite them
The interactive dashboard runs the same break-even, GIR, and scramble models these charts come from, source lines included.
Open the tools